OBD Explorer Demos
Interactive HTML demos for exploring structure in the Ordered Binomial Distribution (OBD).
Repository: github.com/dperlman/OBDExplorer
Available Variants
- Variant 1 - E vs P / E vs N explorer with range controls and tie-point overlays.
- Variant 2 - Dual-panel view: binomial distribution and PCA projection.
- Variant 3 - Quad layout with binomial view, PCA view, and E vs p panel.
- Variant 4 - PCA-only explorer with projection controls.
- Variant 5 - Tie-field values vs n at selected tie index/range.
- Variant 6 - Tie-field values vs tie index for selected n/range.
- Variant 7 - Nearest tie values graph explorer on configurable p-grid.
Live Demo Links
Direct GitHub Pages URLs for sharing and external access.
Example Plots
Static example plot images generated from the project.
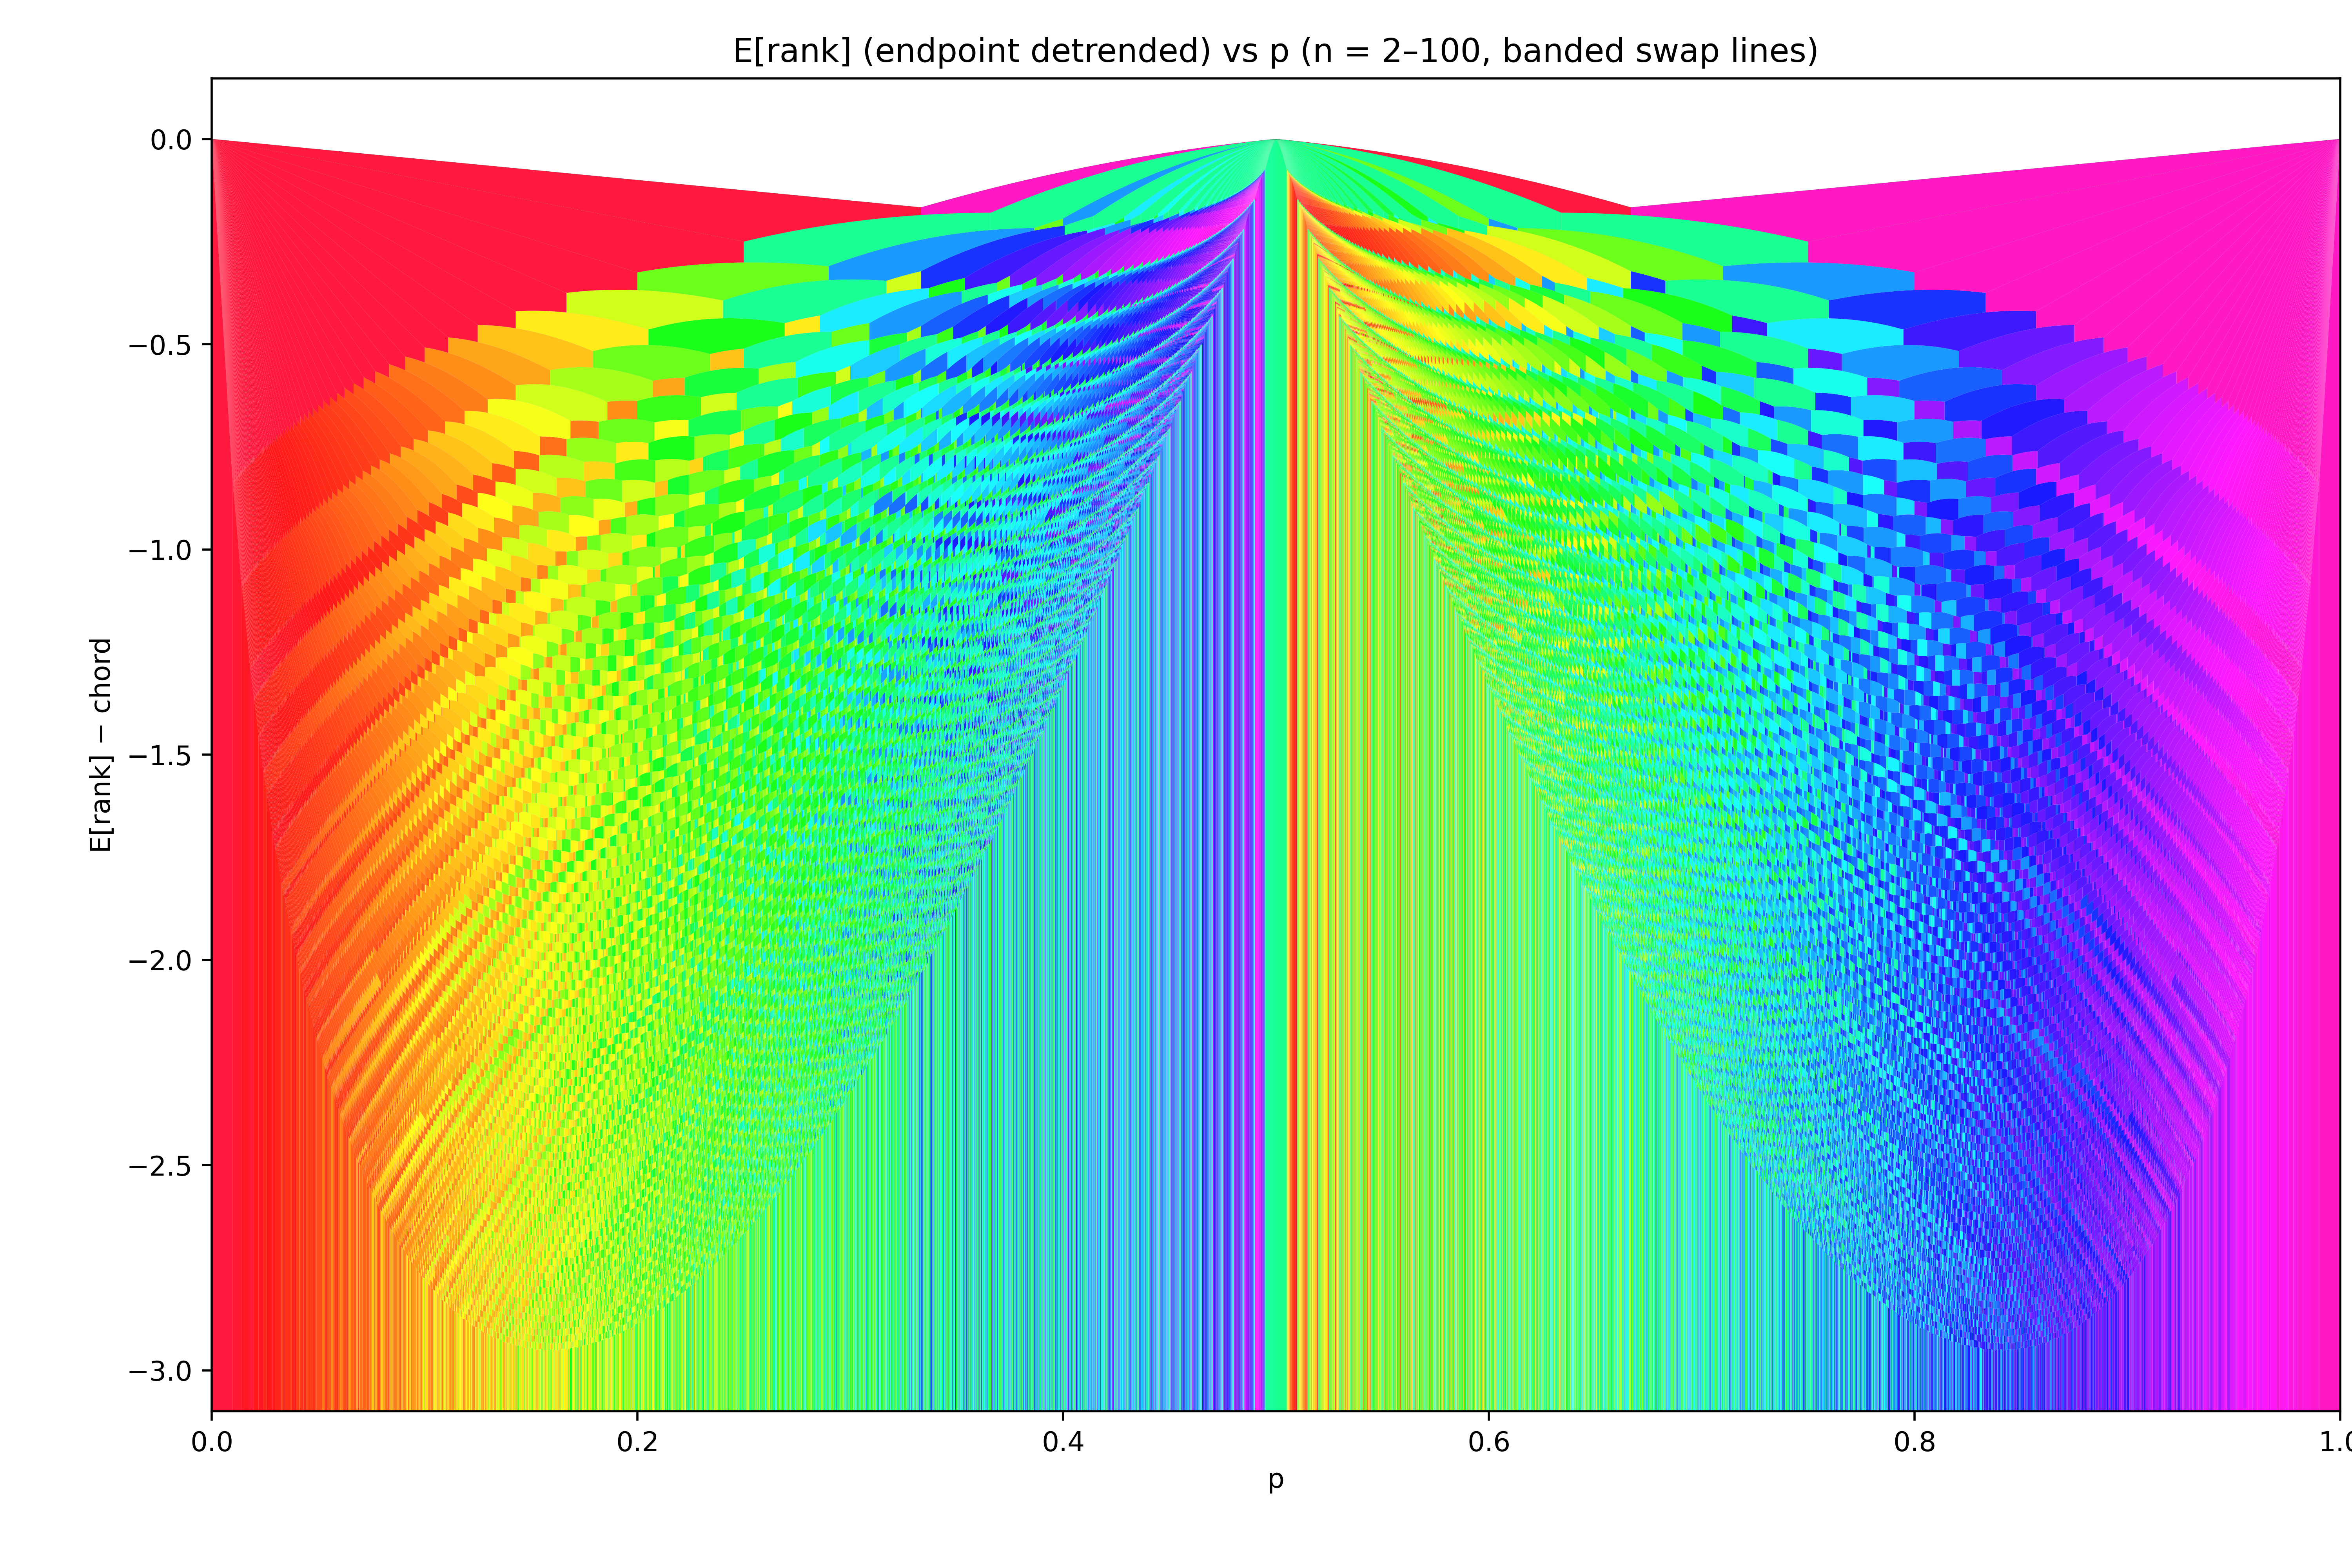
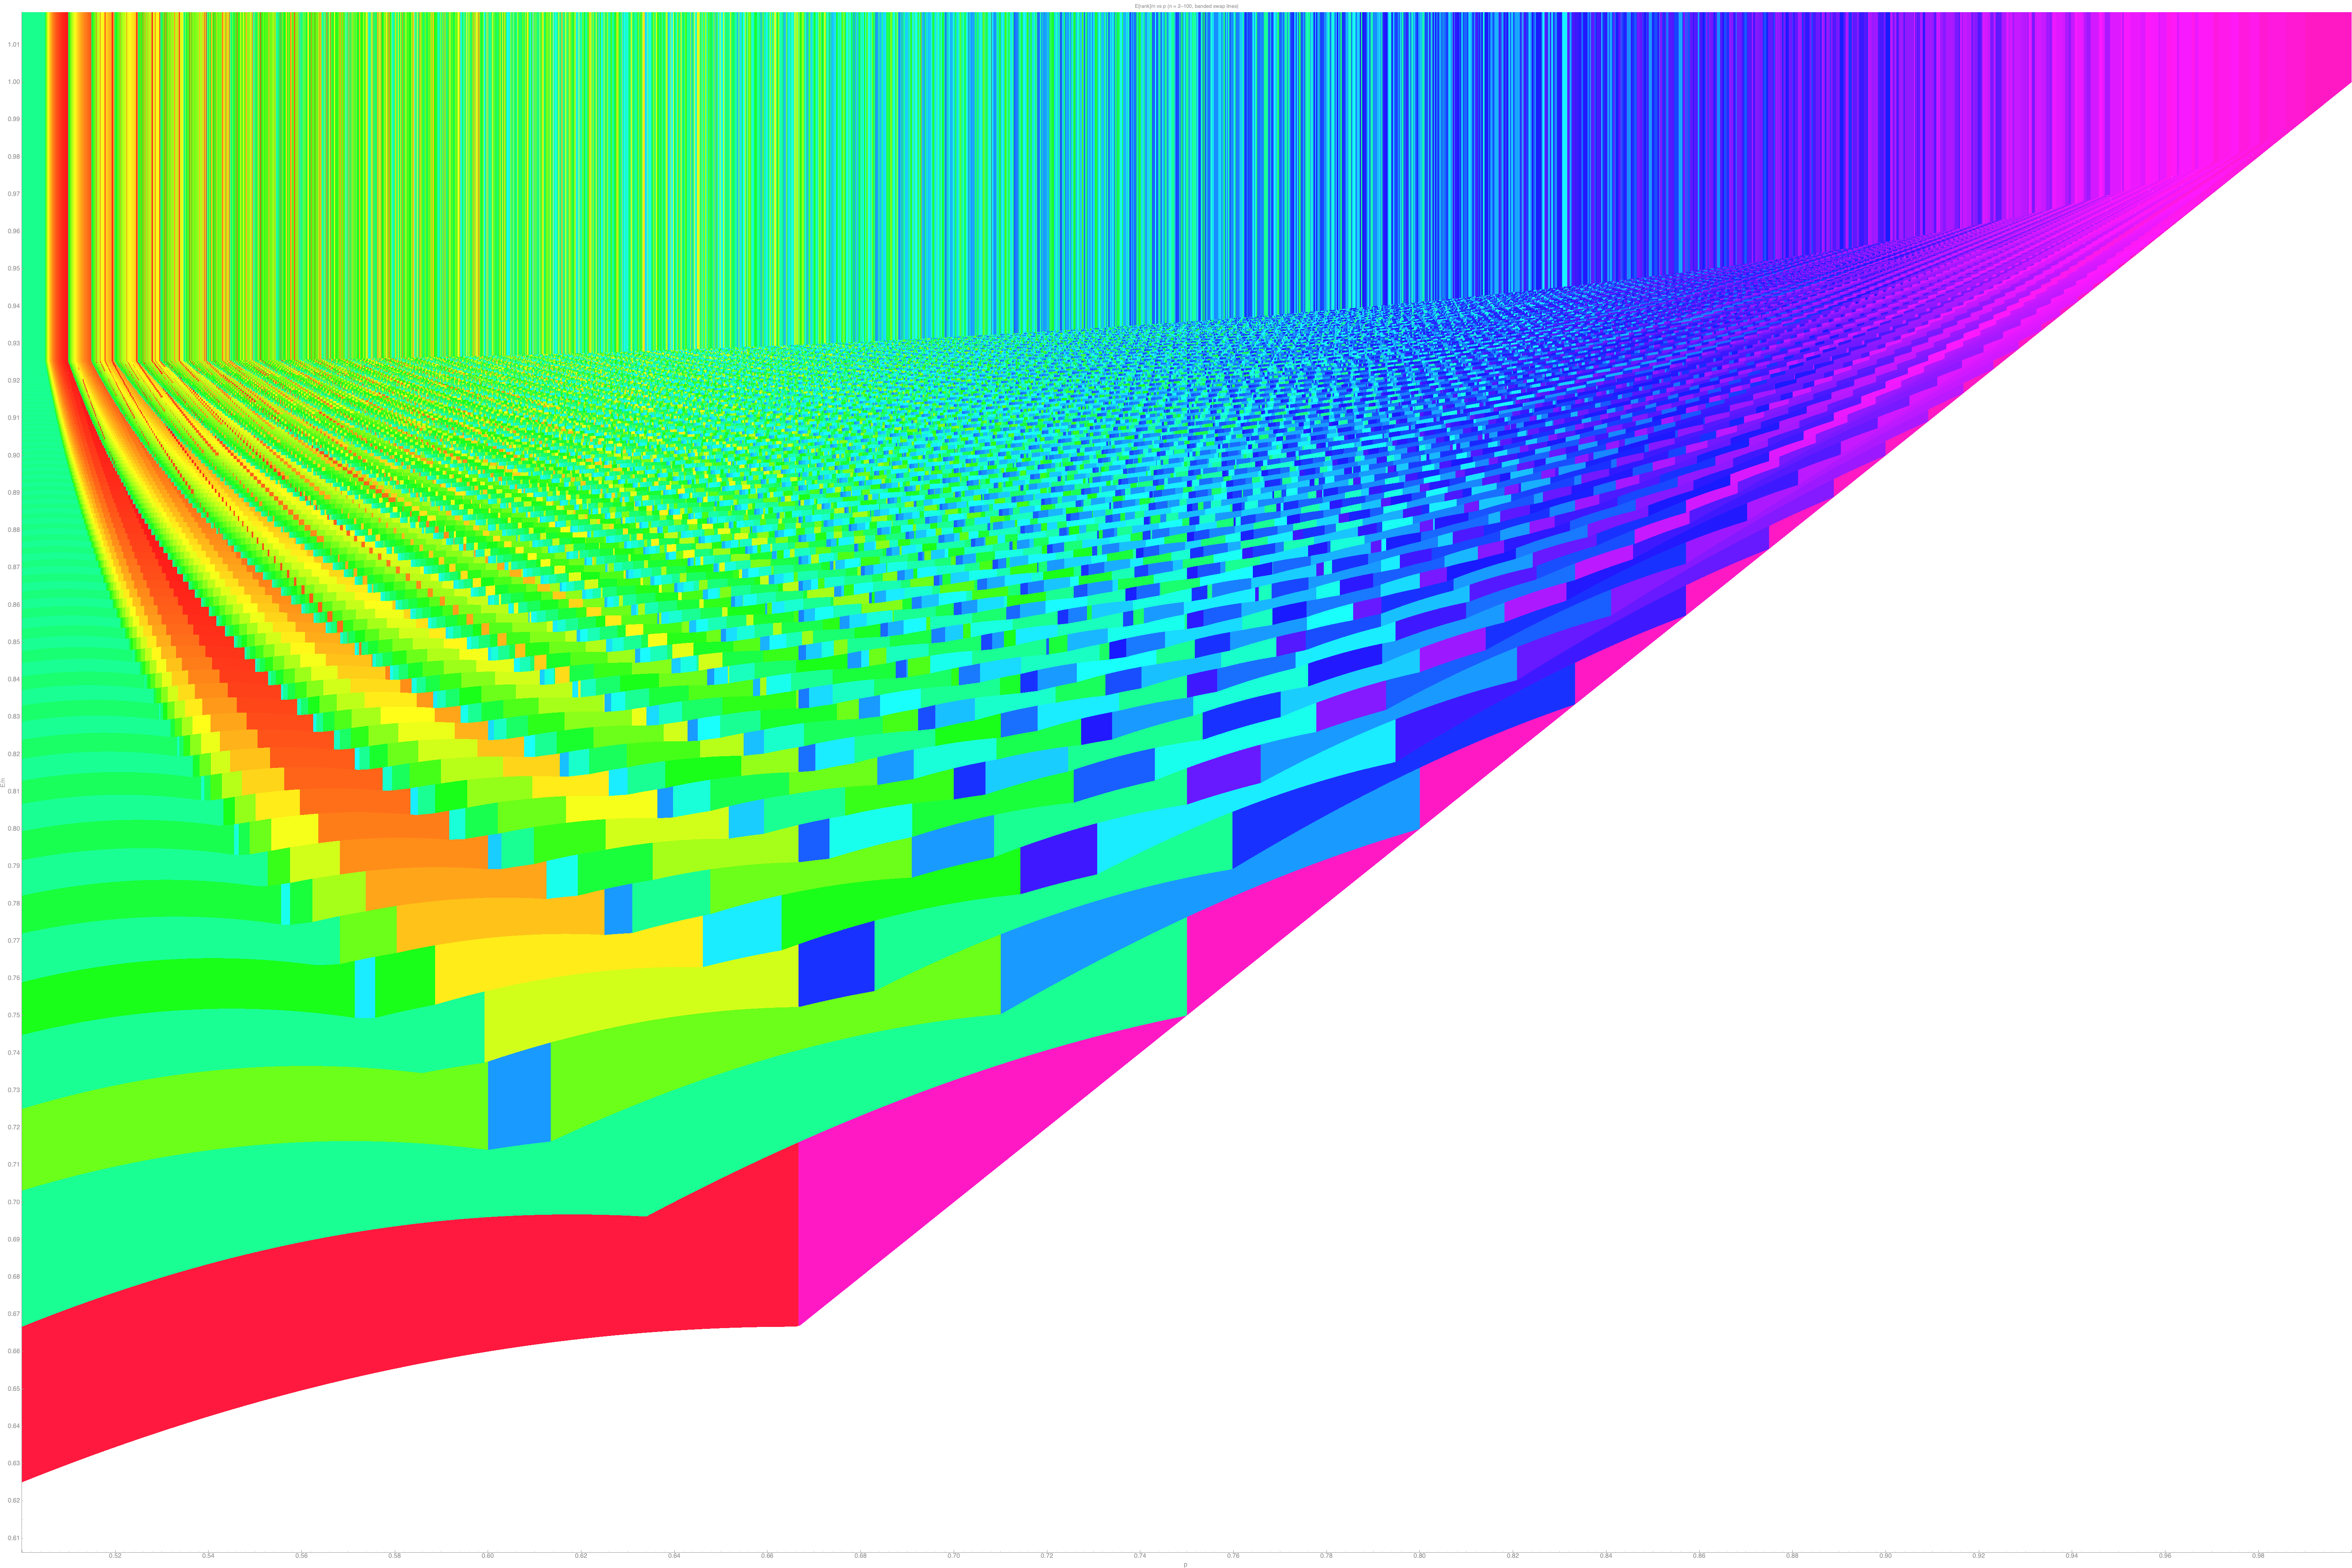
- N-p Color Tie Graph (Detrended, Full) (May 2026 original)
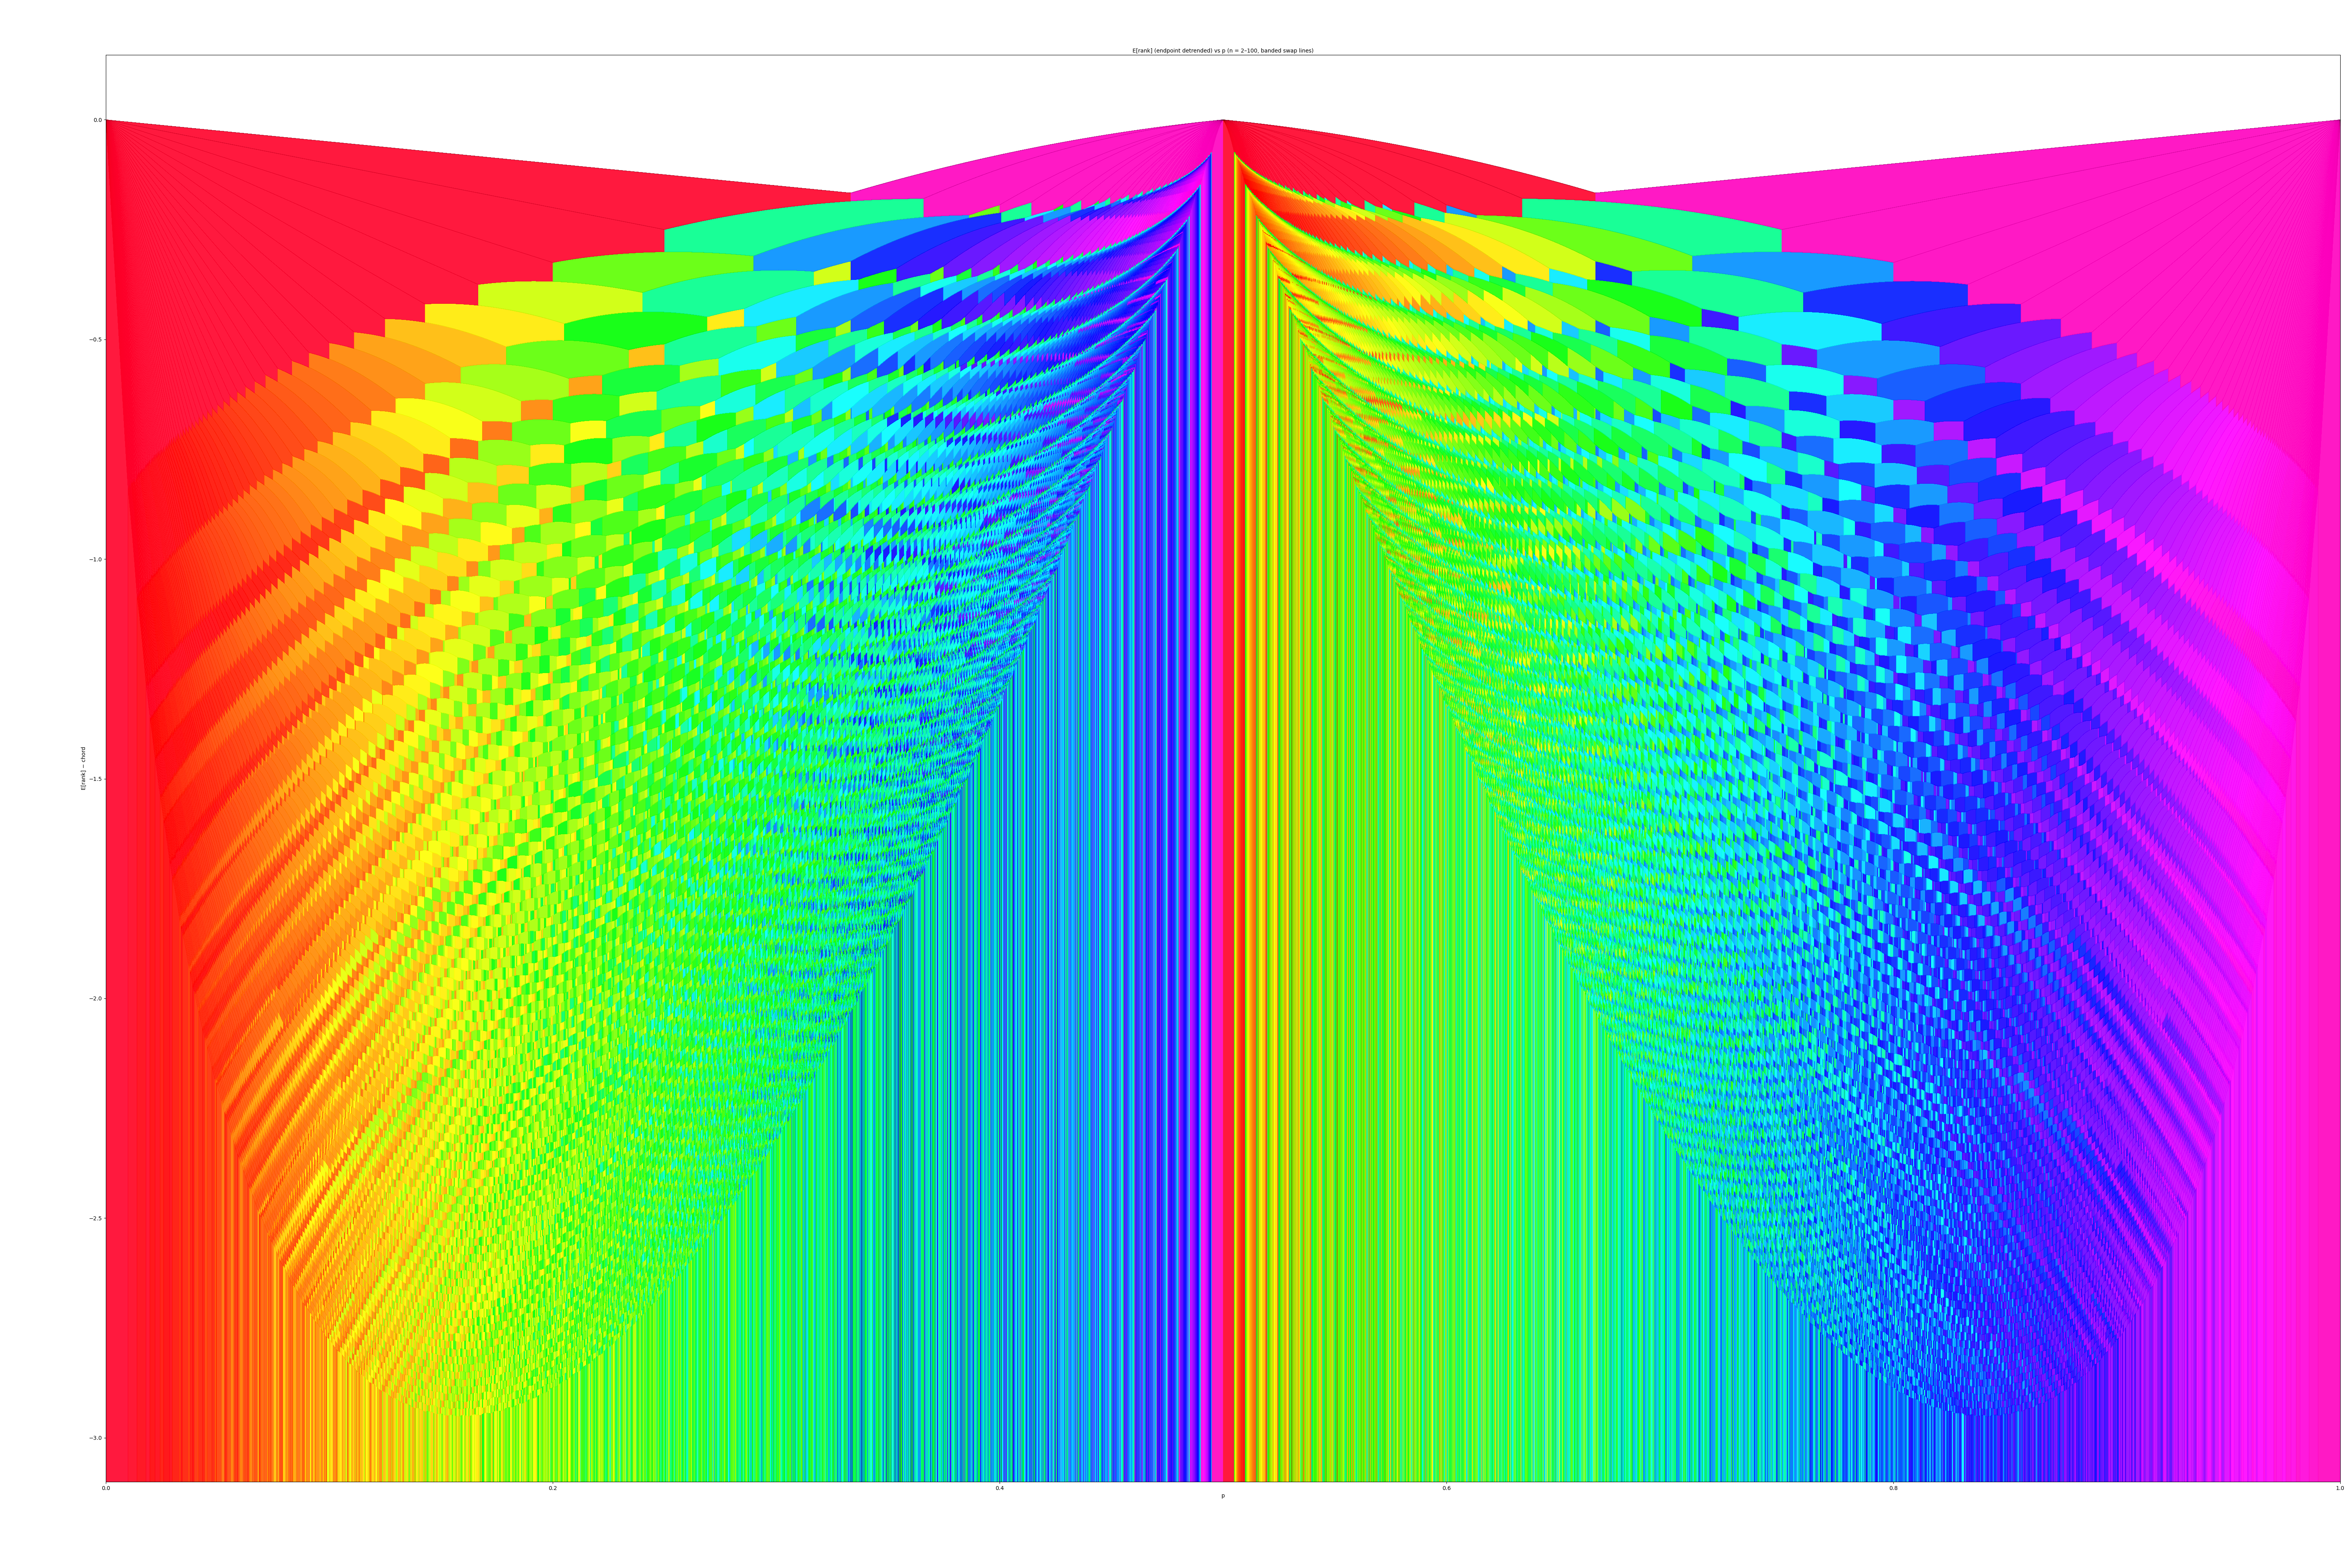
- N-p Color Tie Graph (Full)
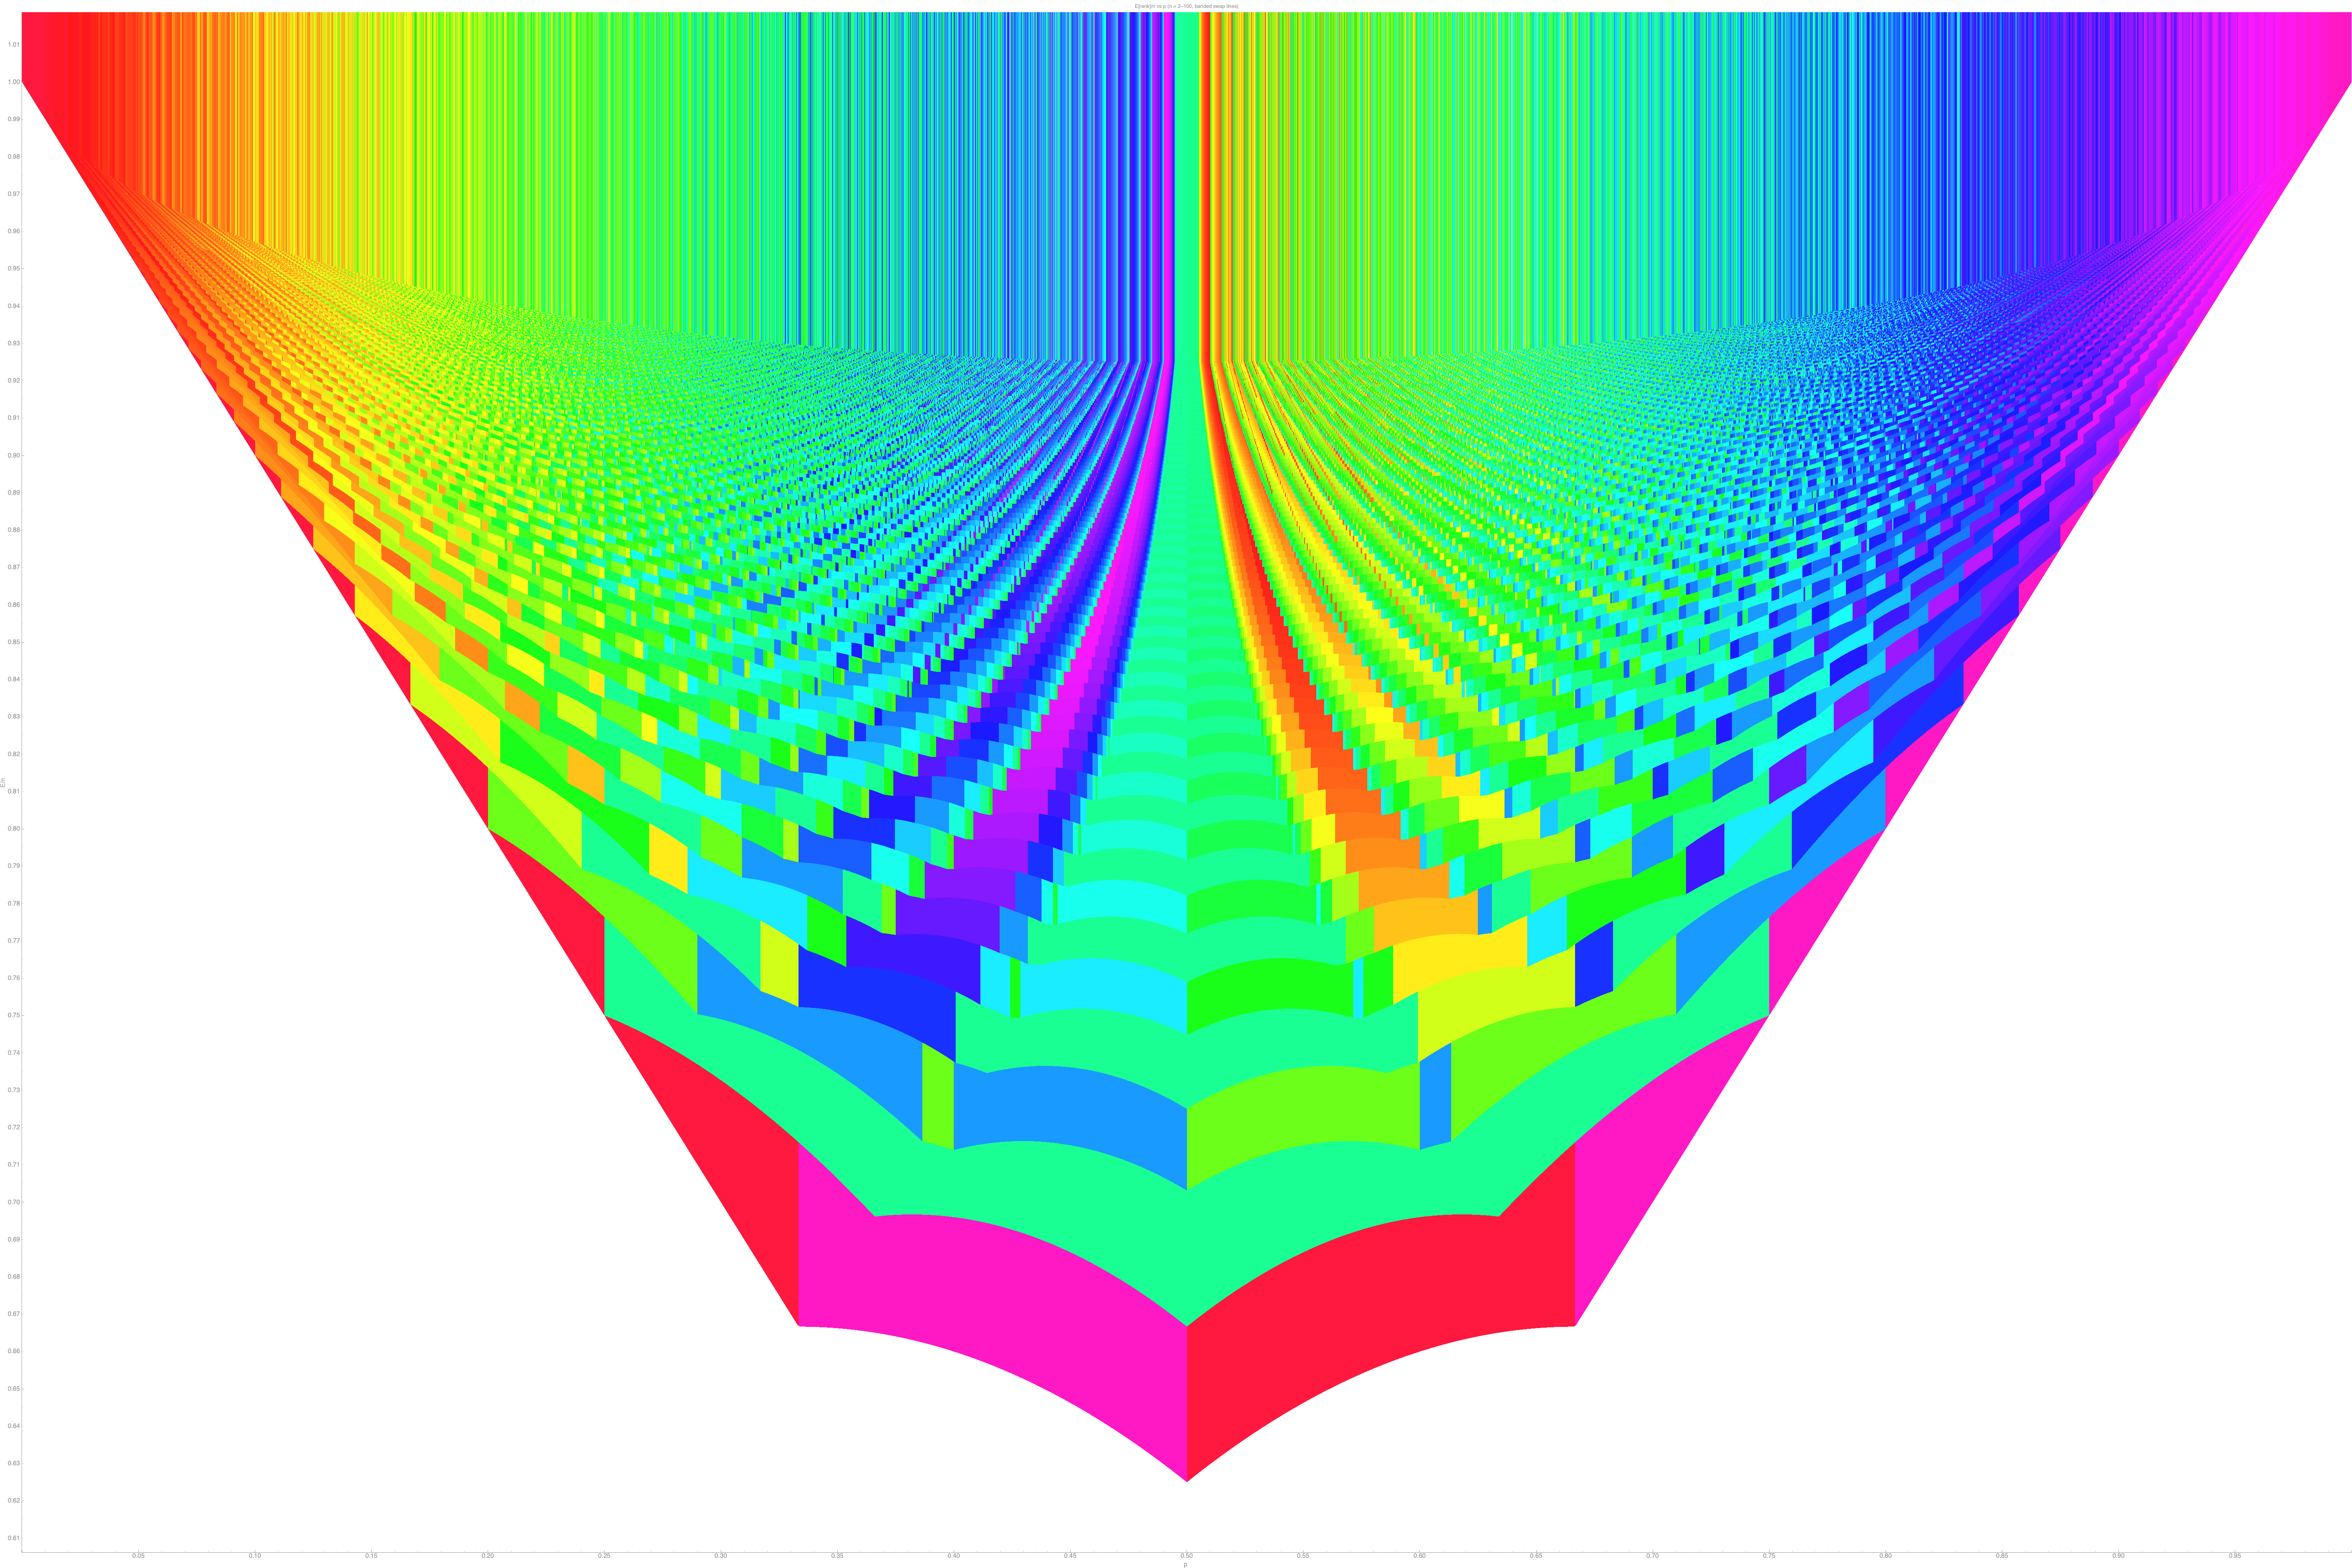
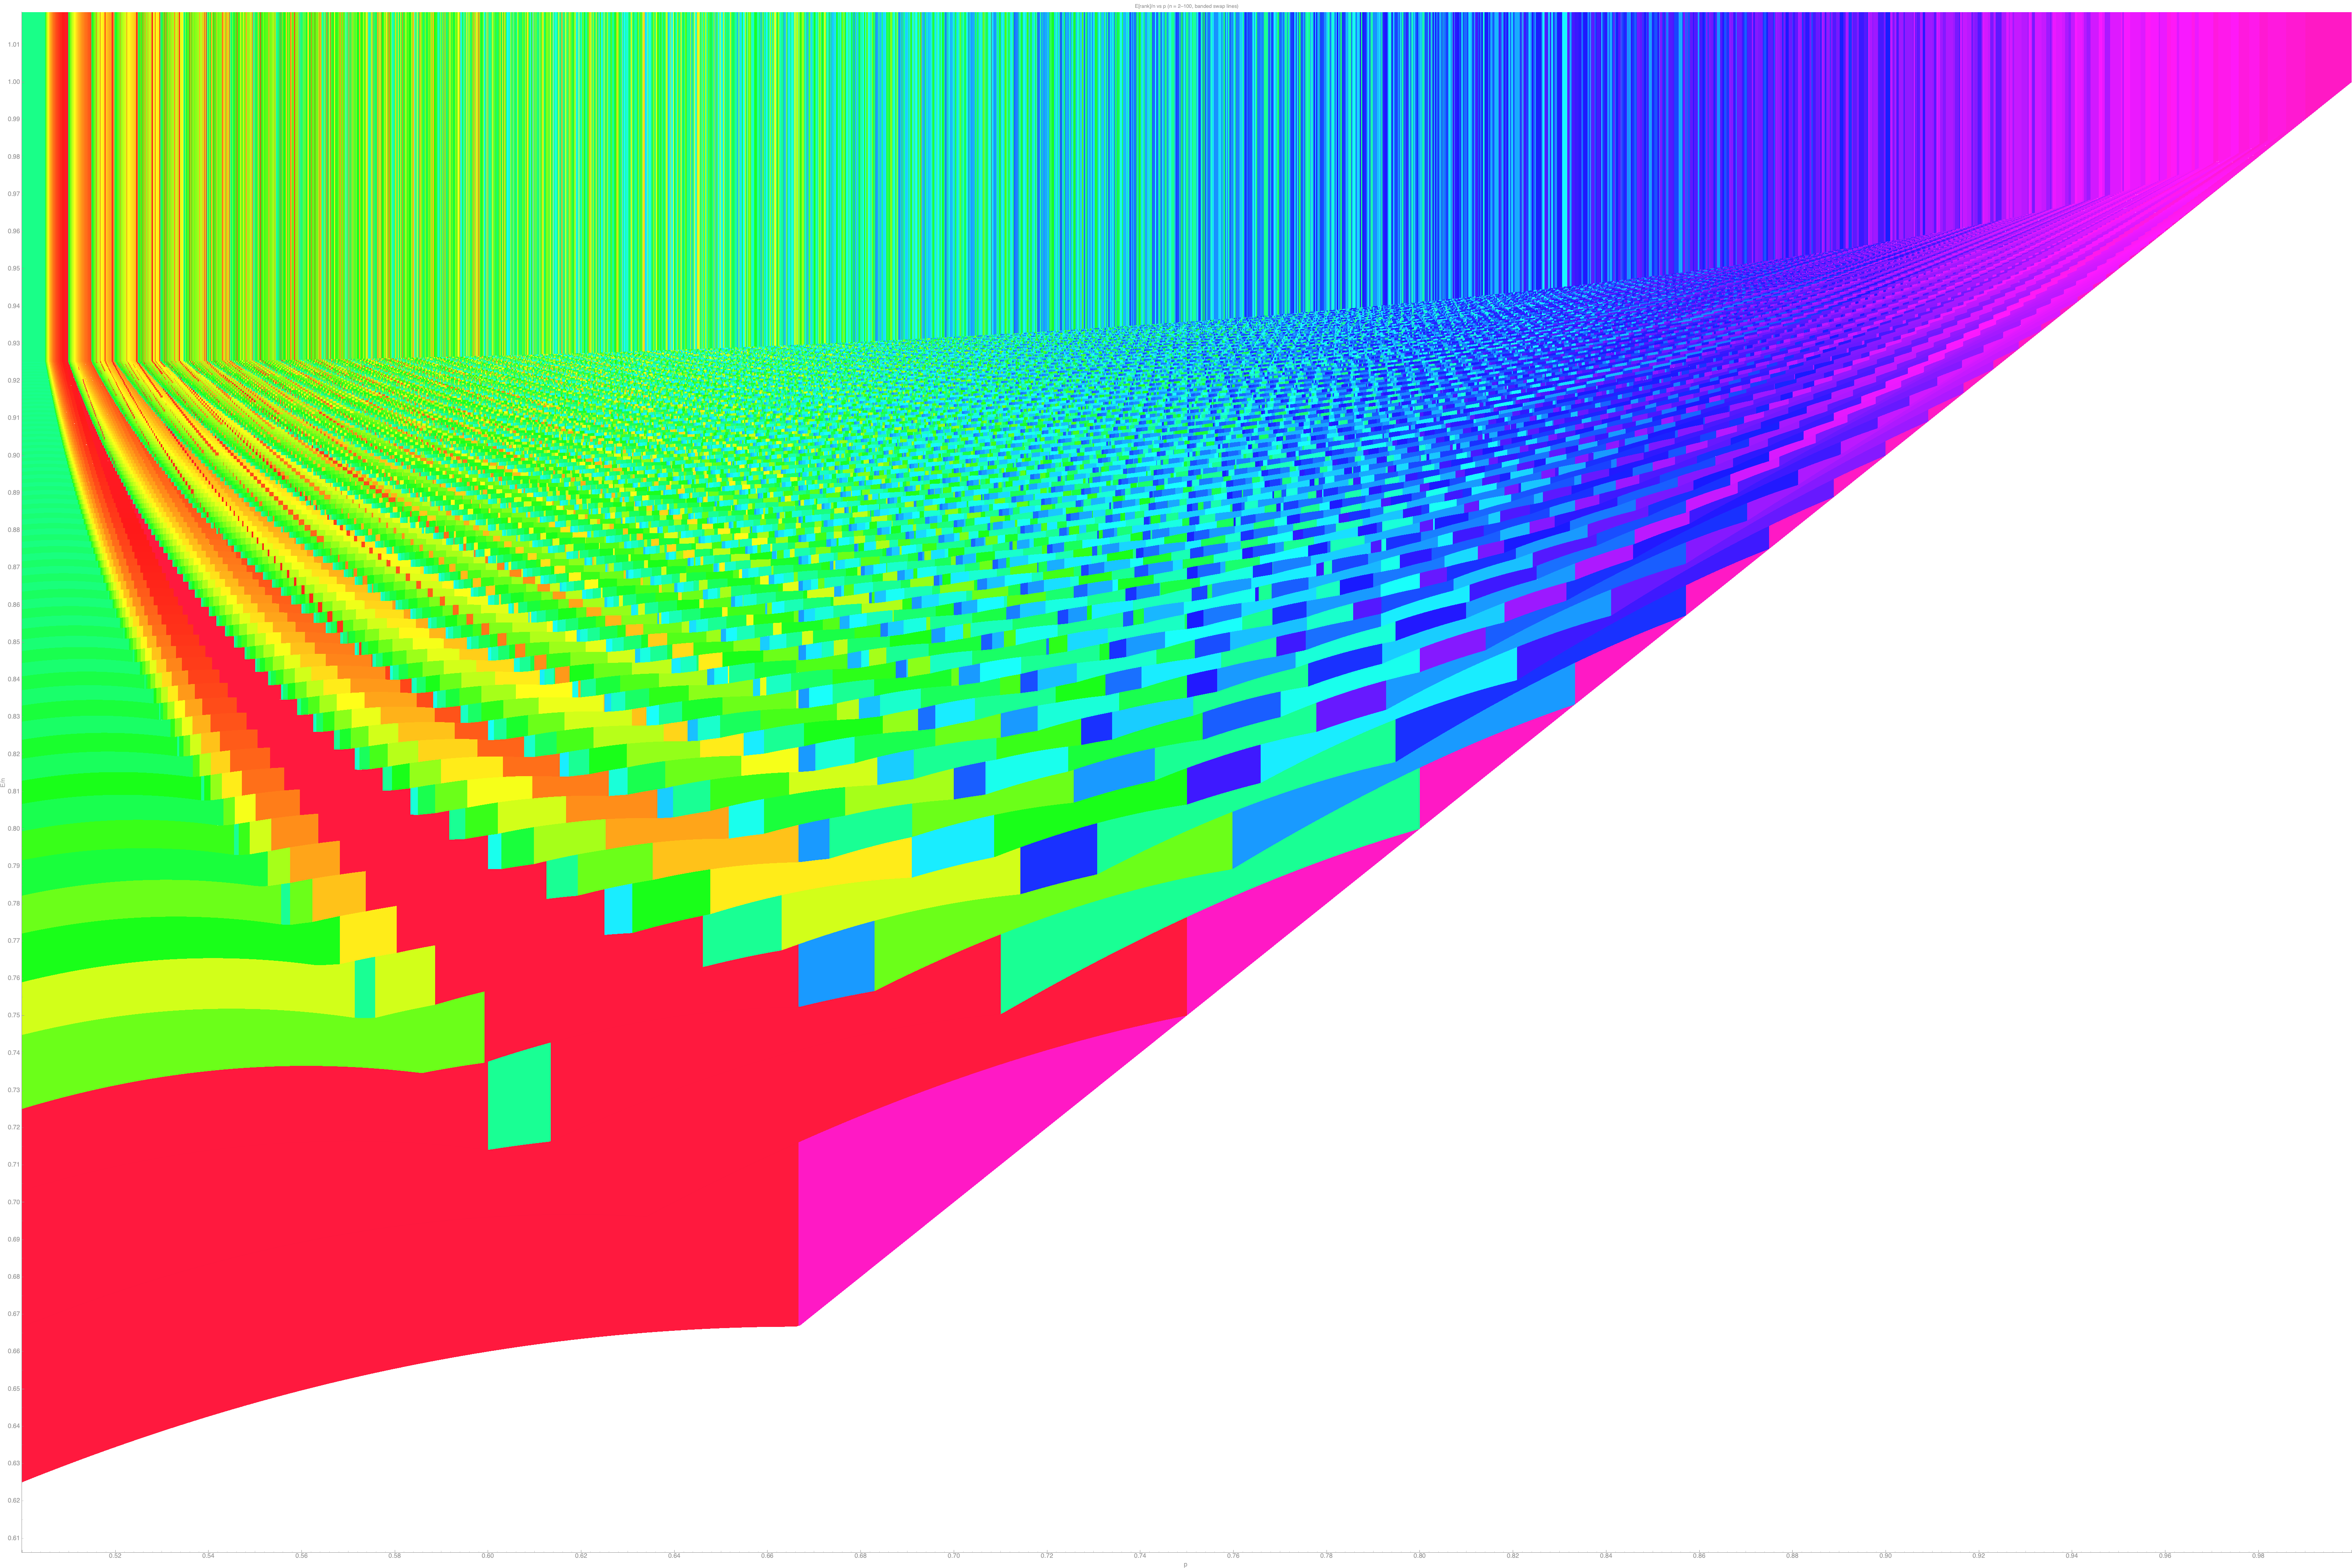
- N-p Color Tie Graph (Half) (May 2026 original)
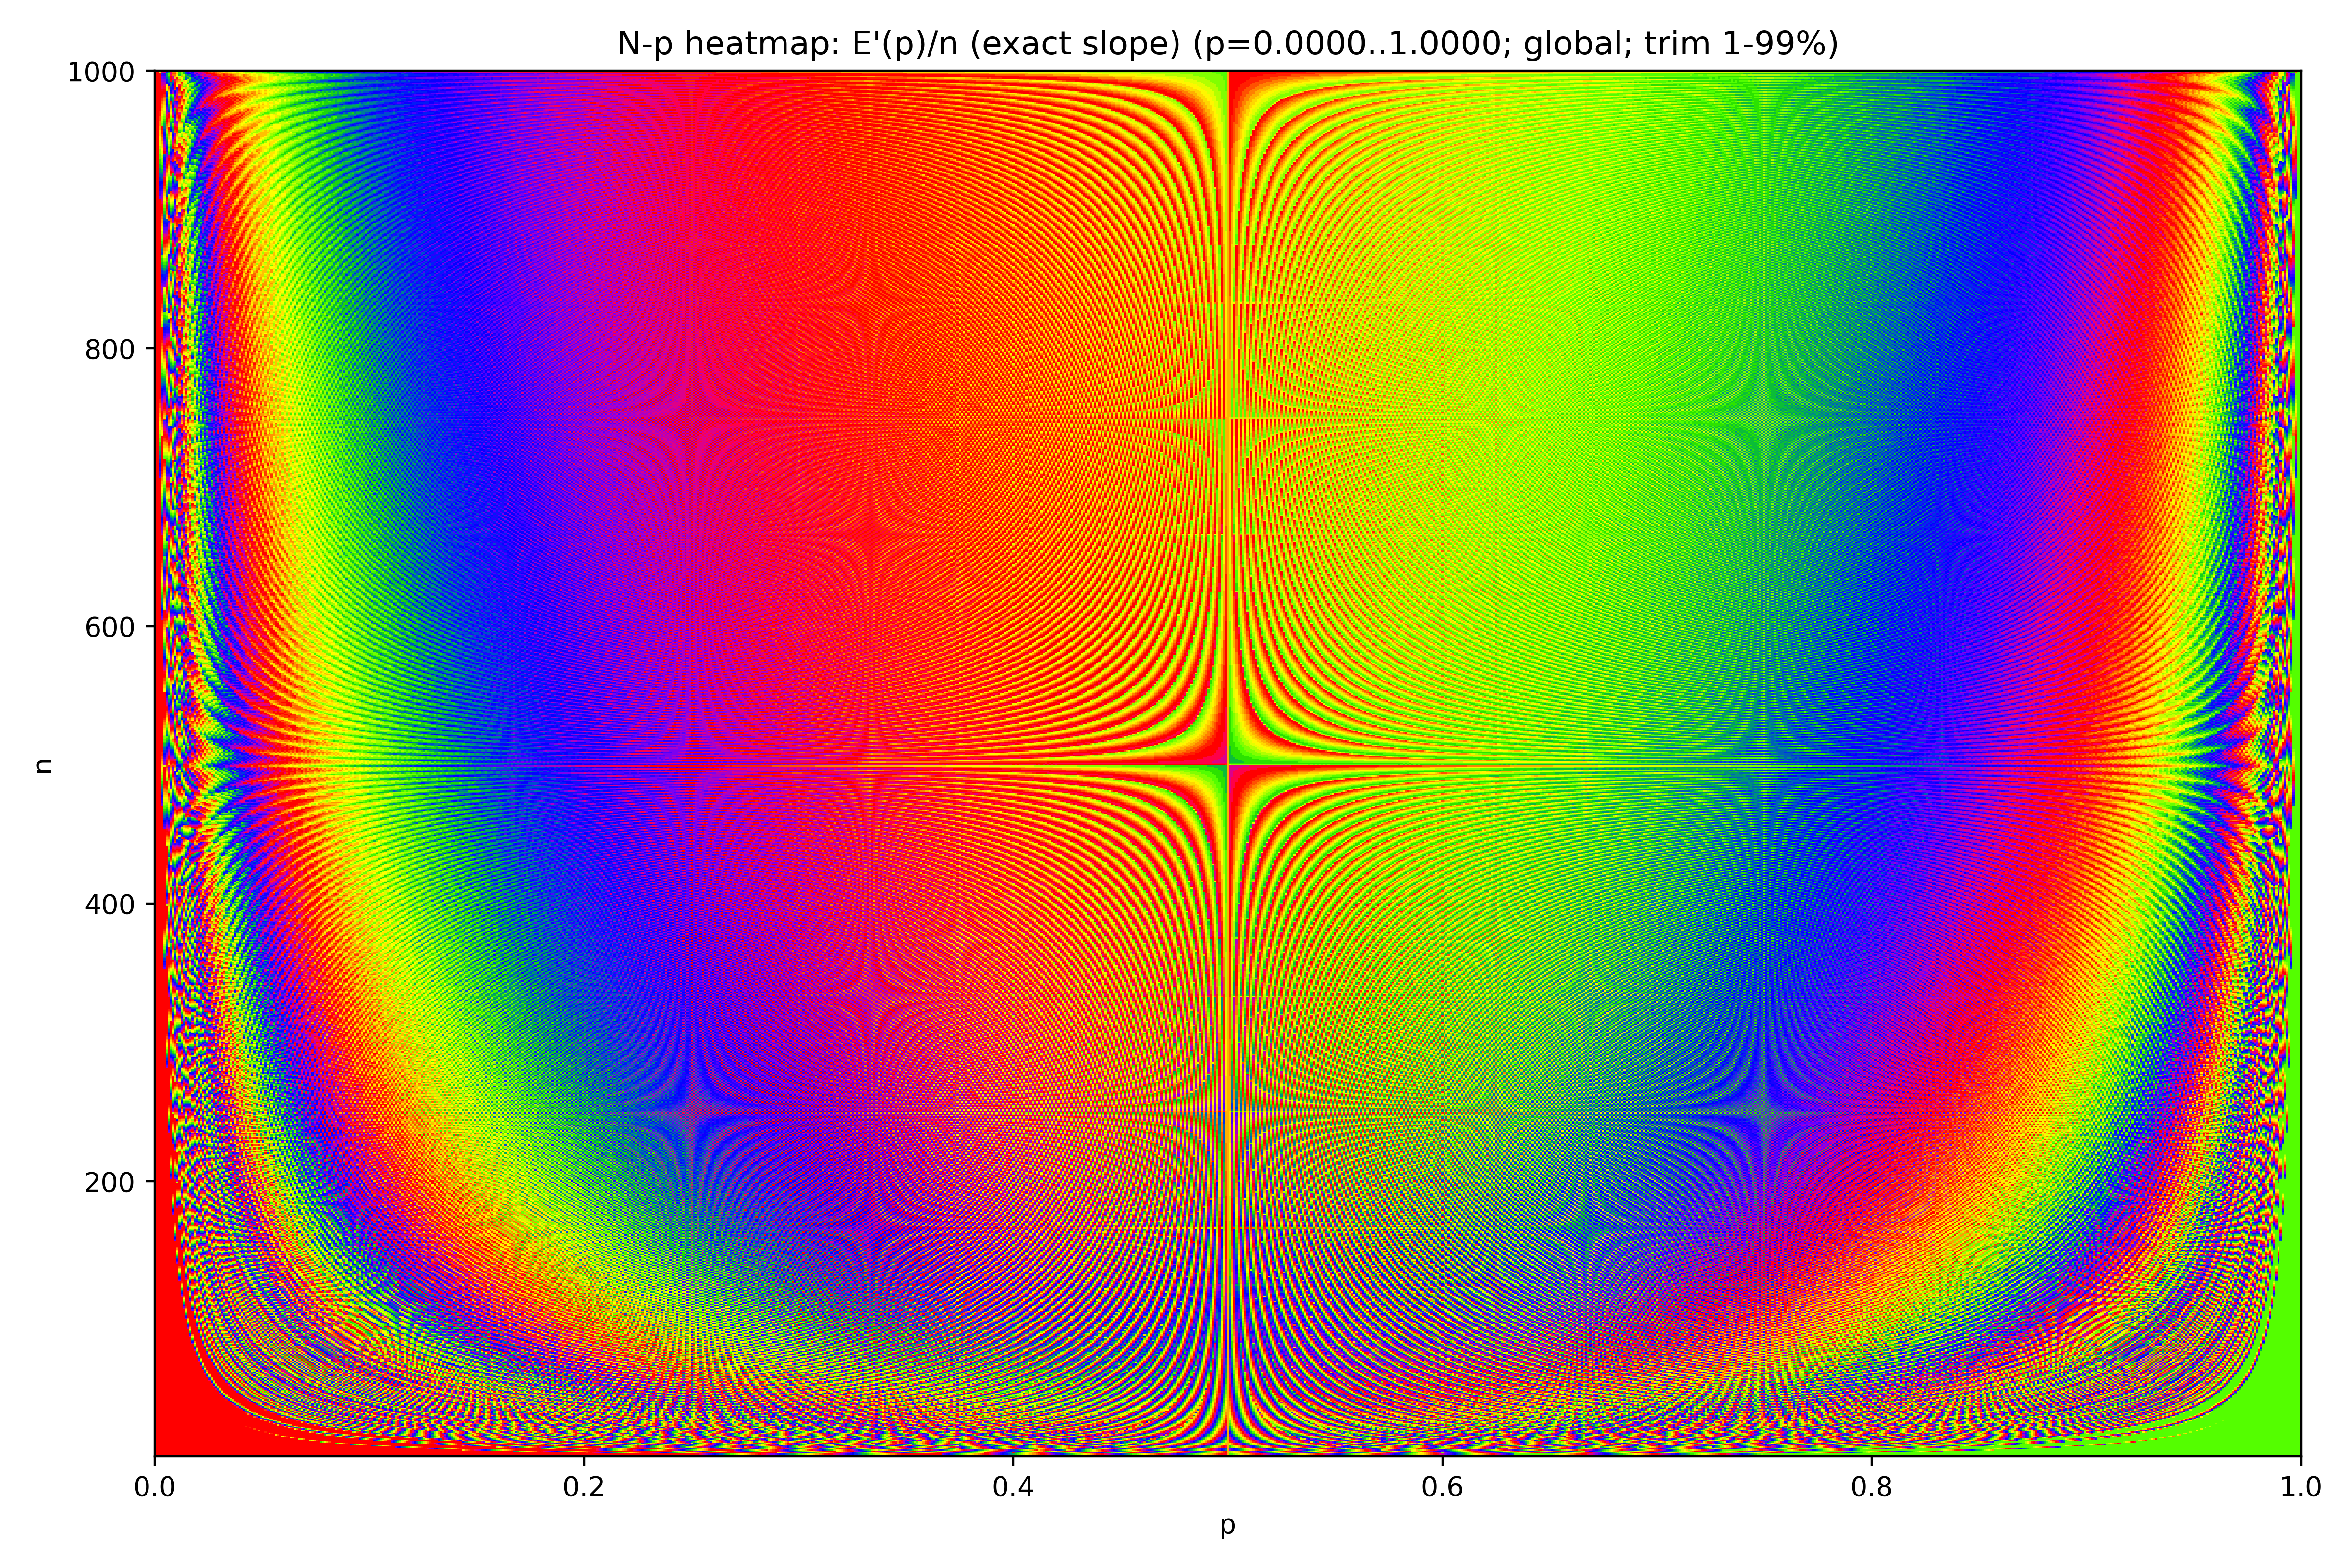
- N-p Heatmap: E'(p)/n, the exact slope (Annotated)
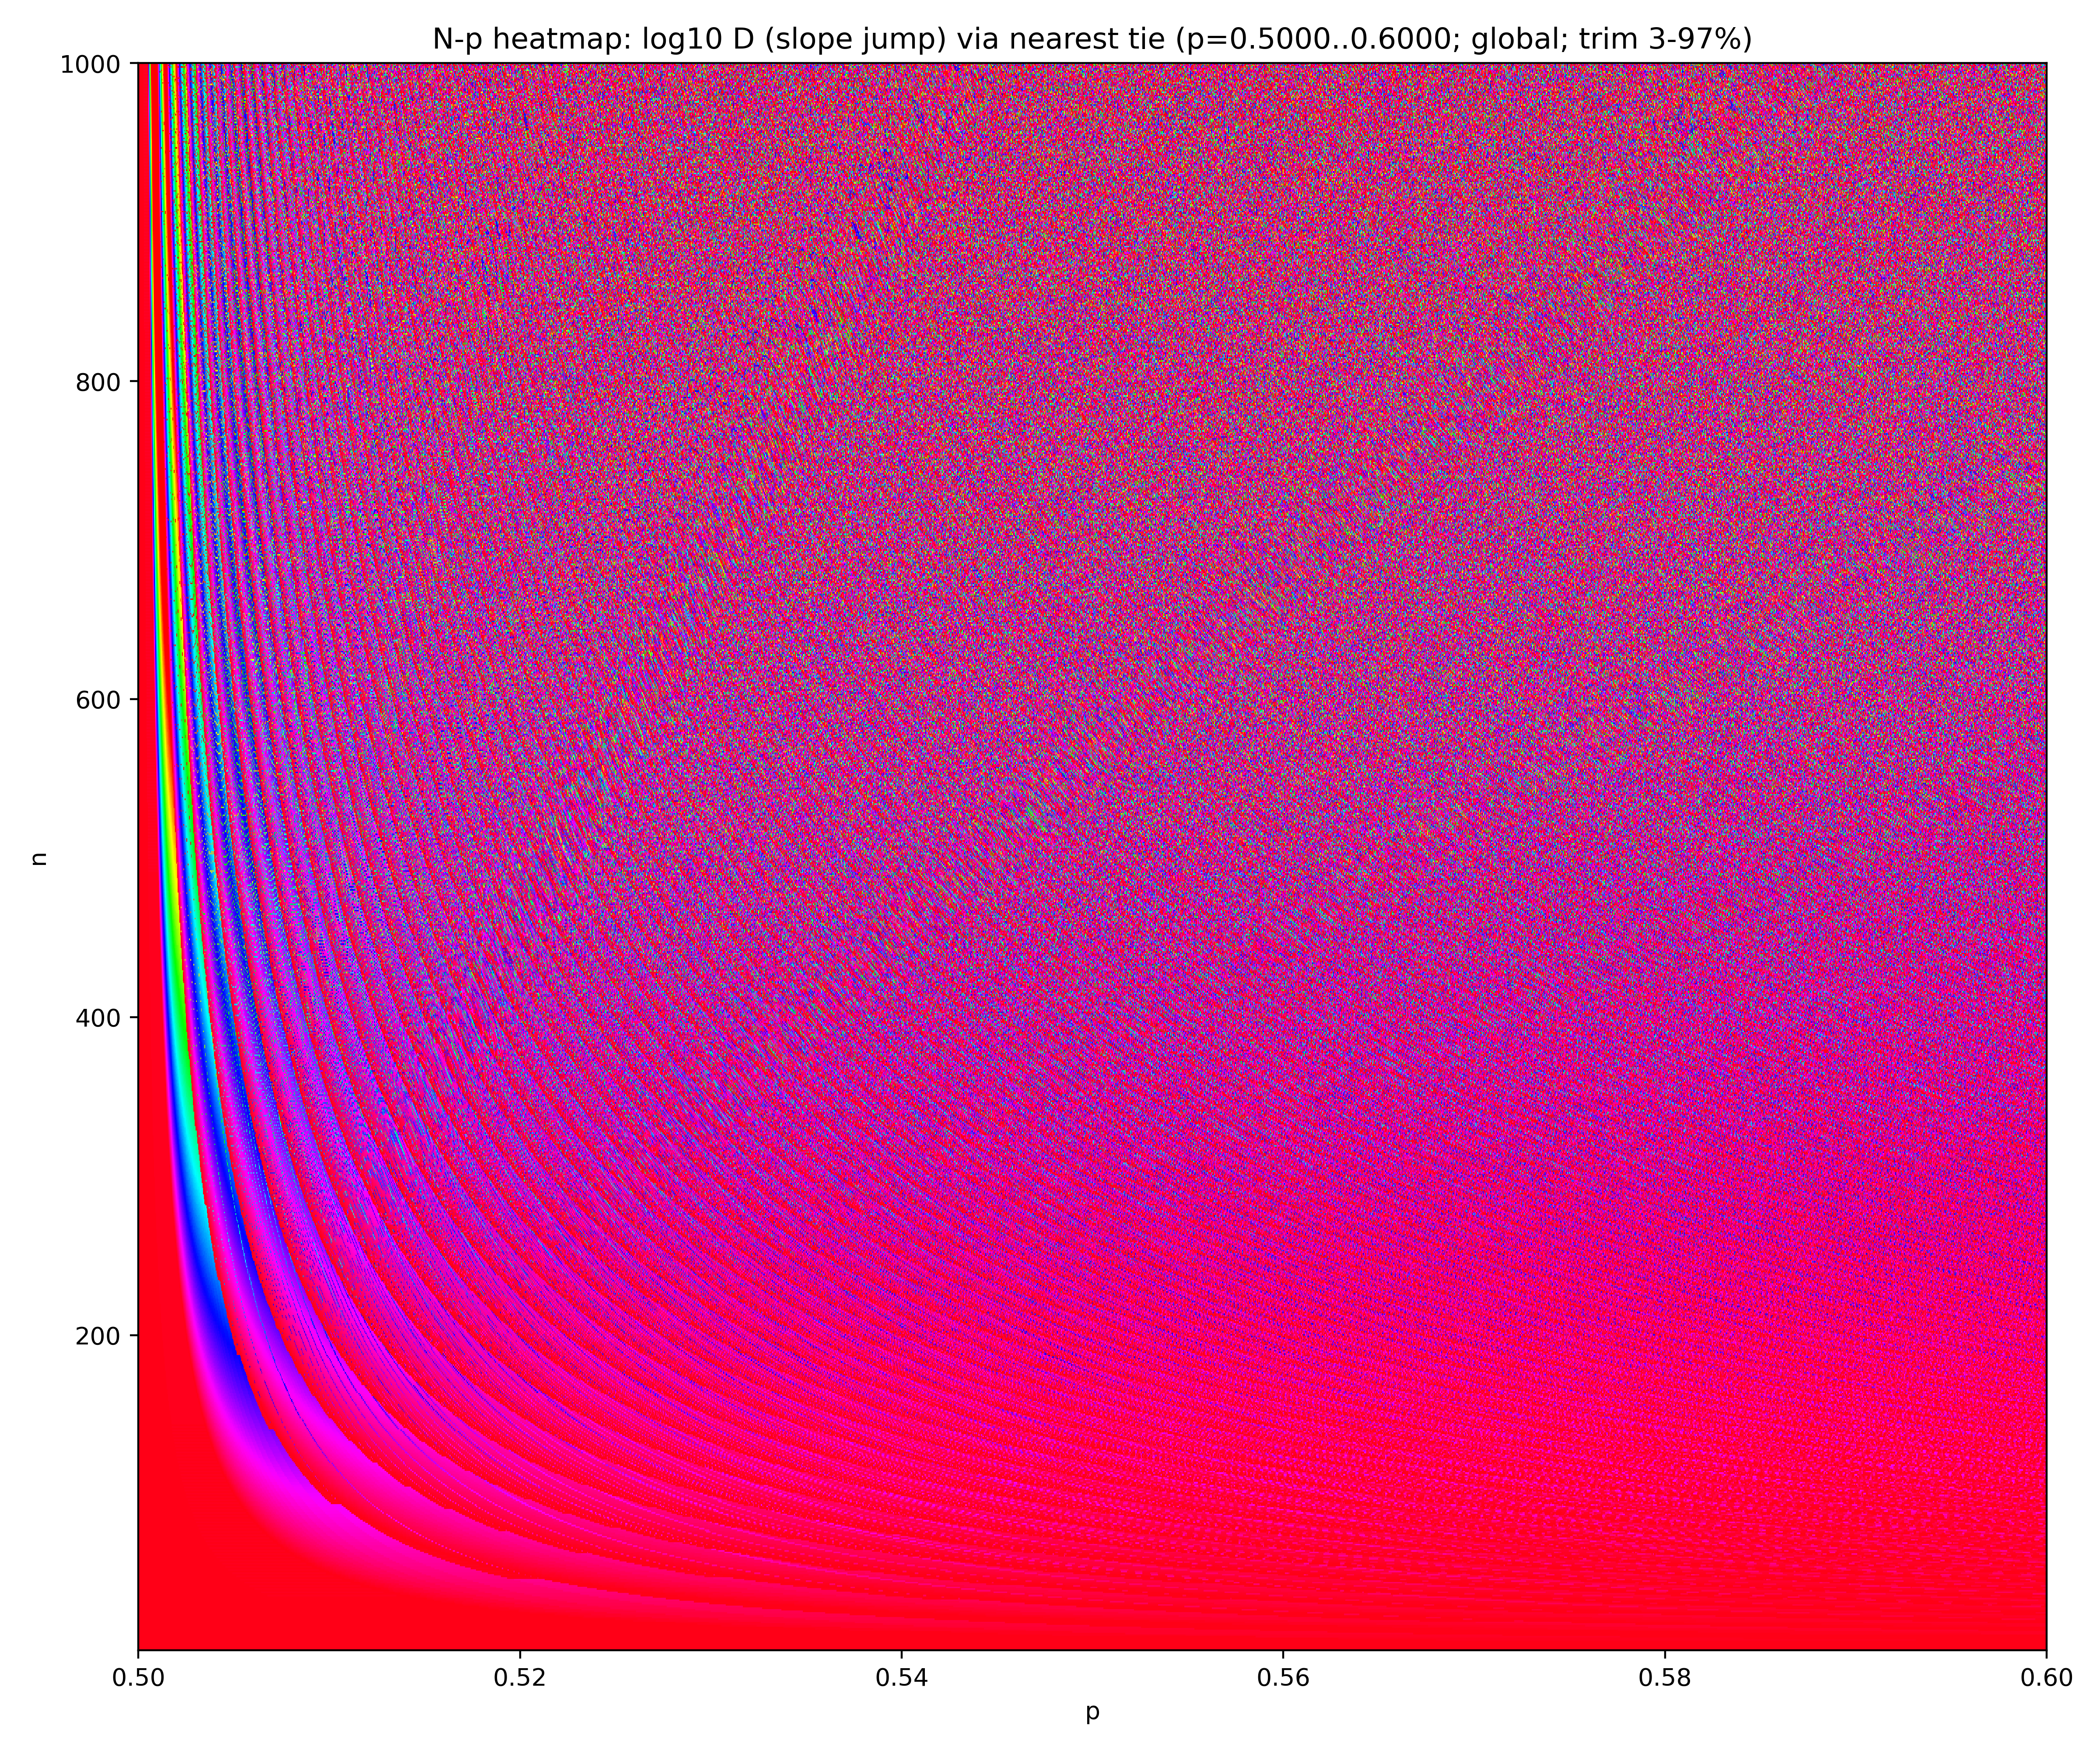
- N-p Heatmap: log10 D, the slope jump at the nearest tie point
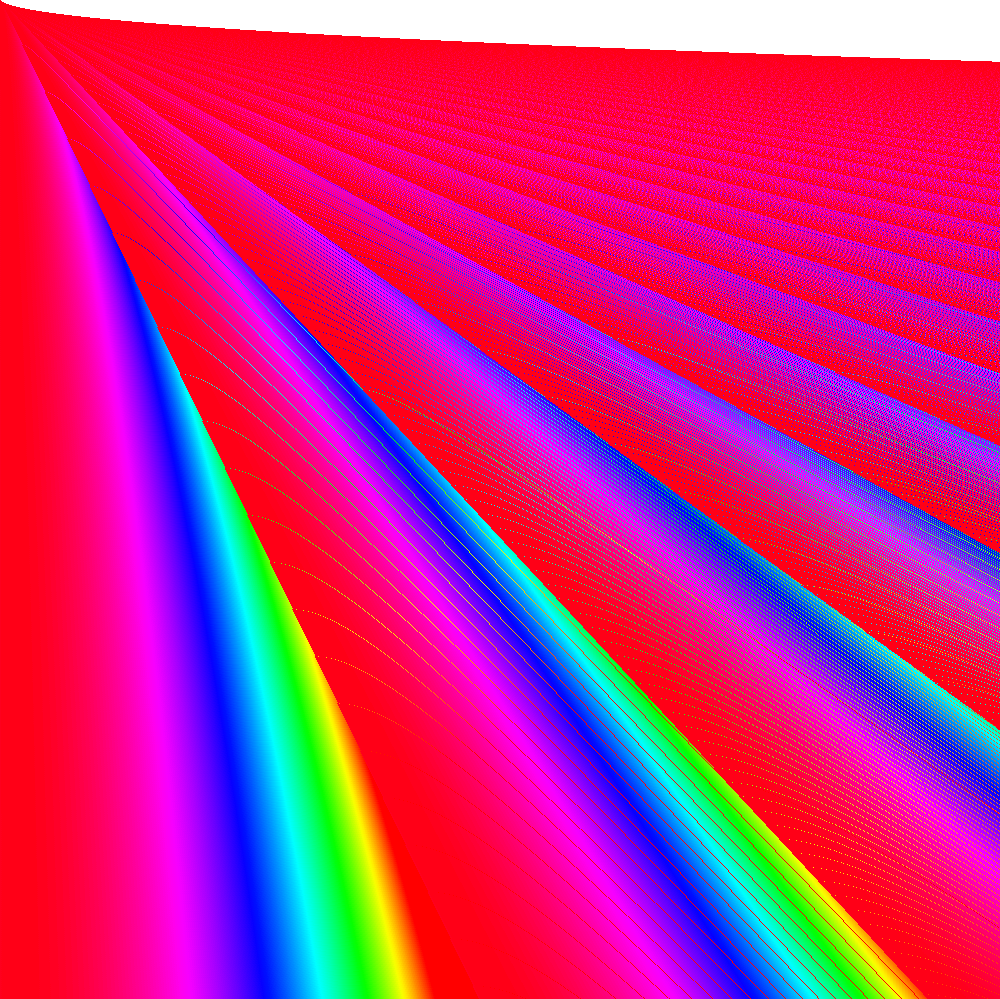
- N-tie Heatmap: log10 D by tie index (Exact)
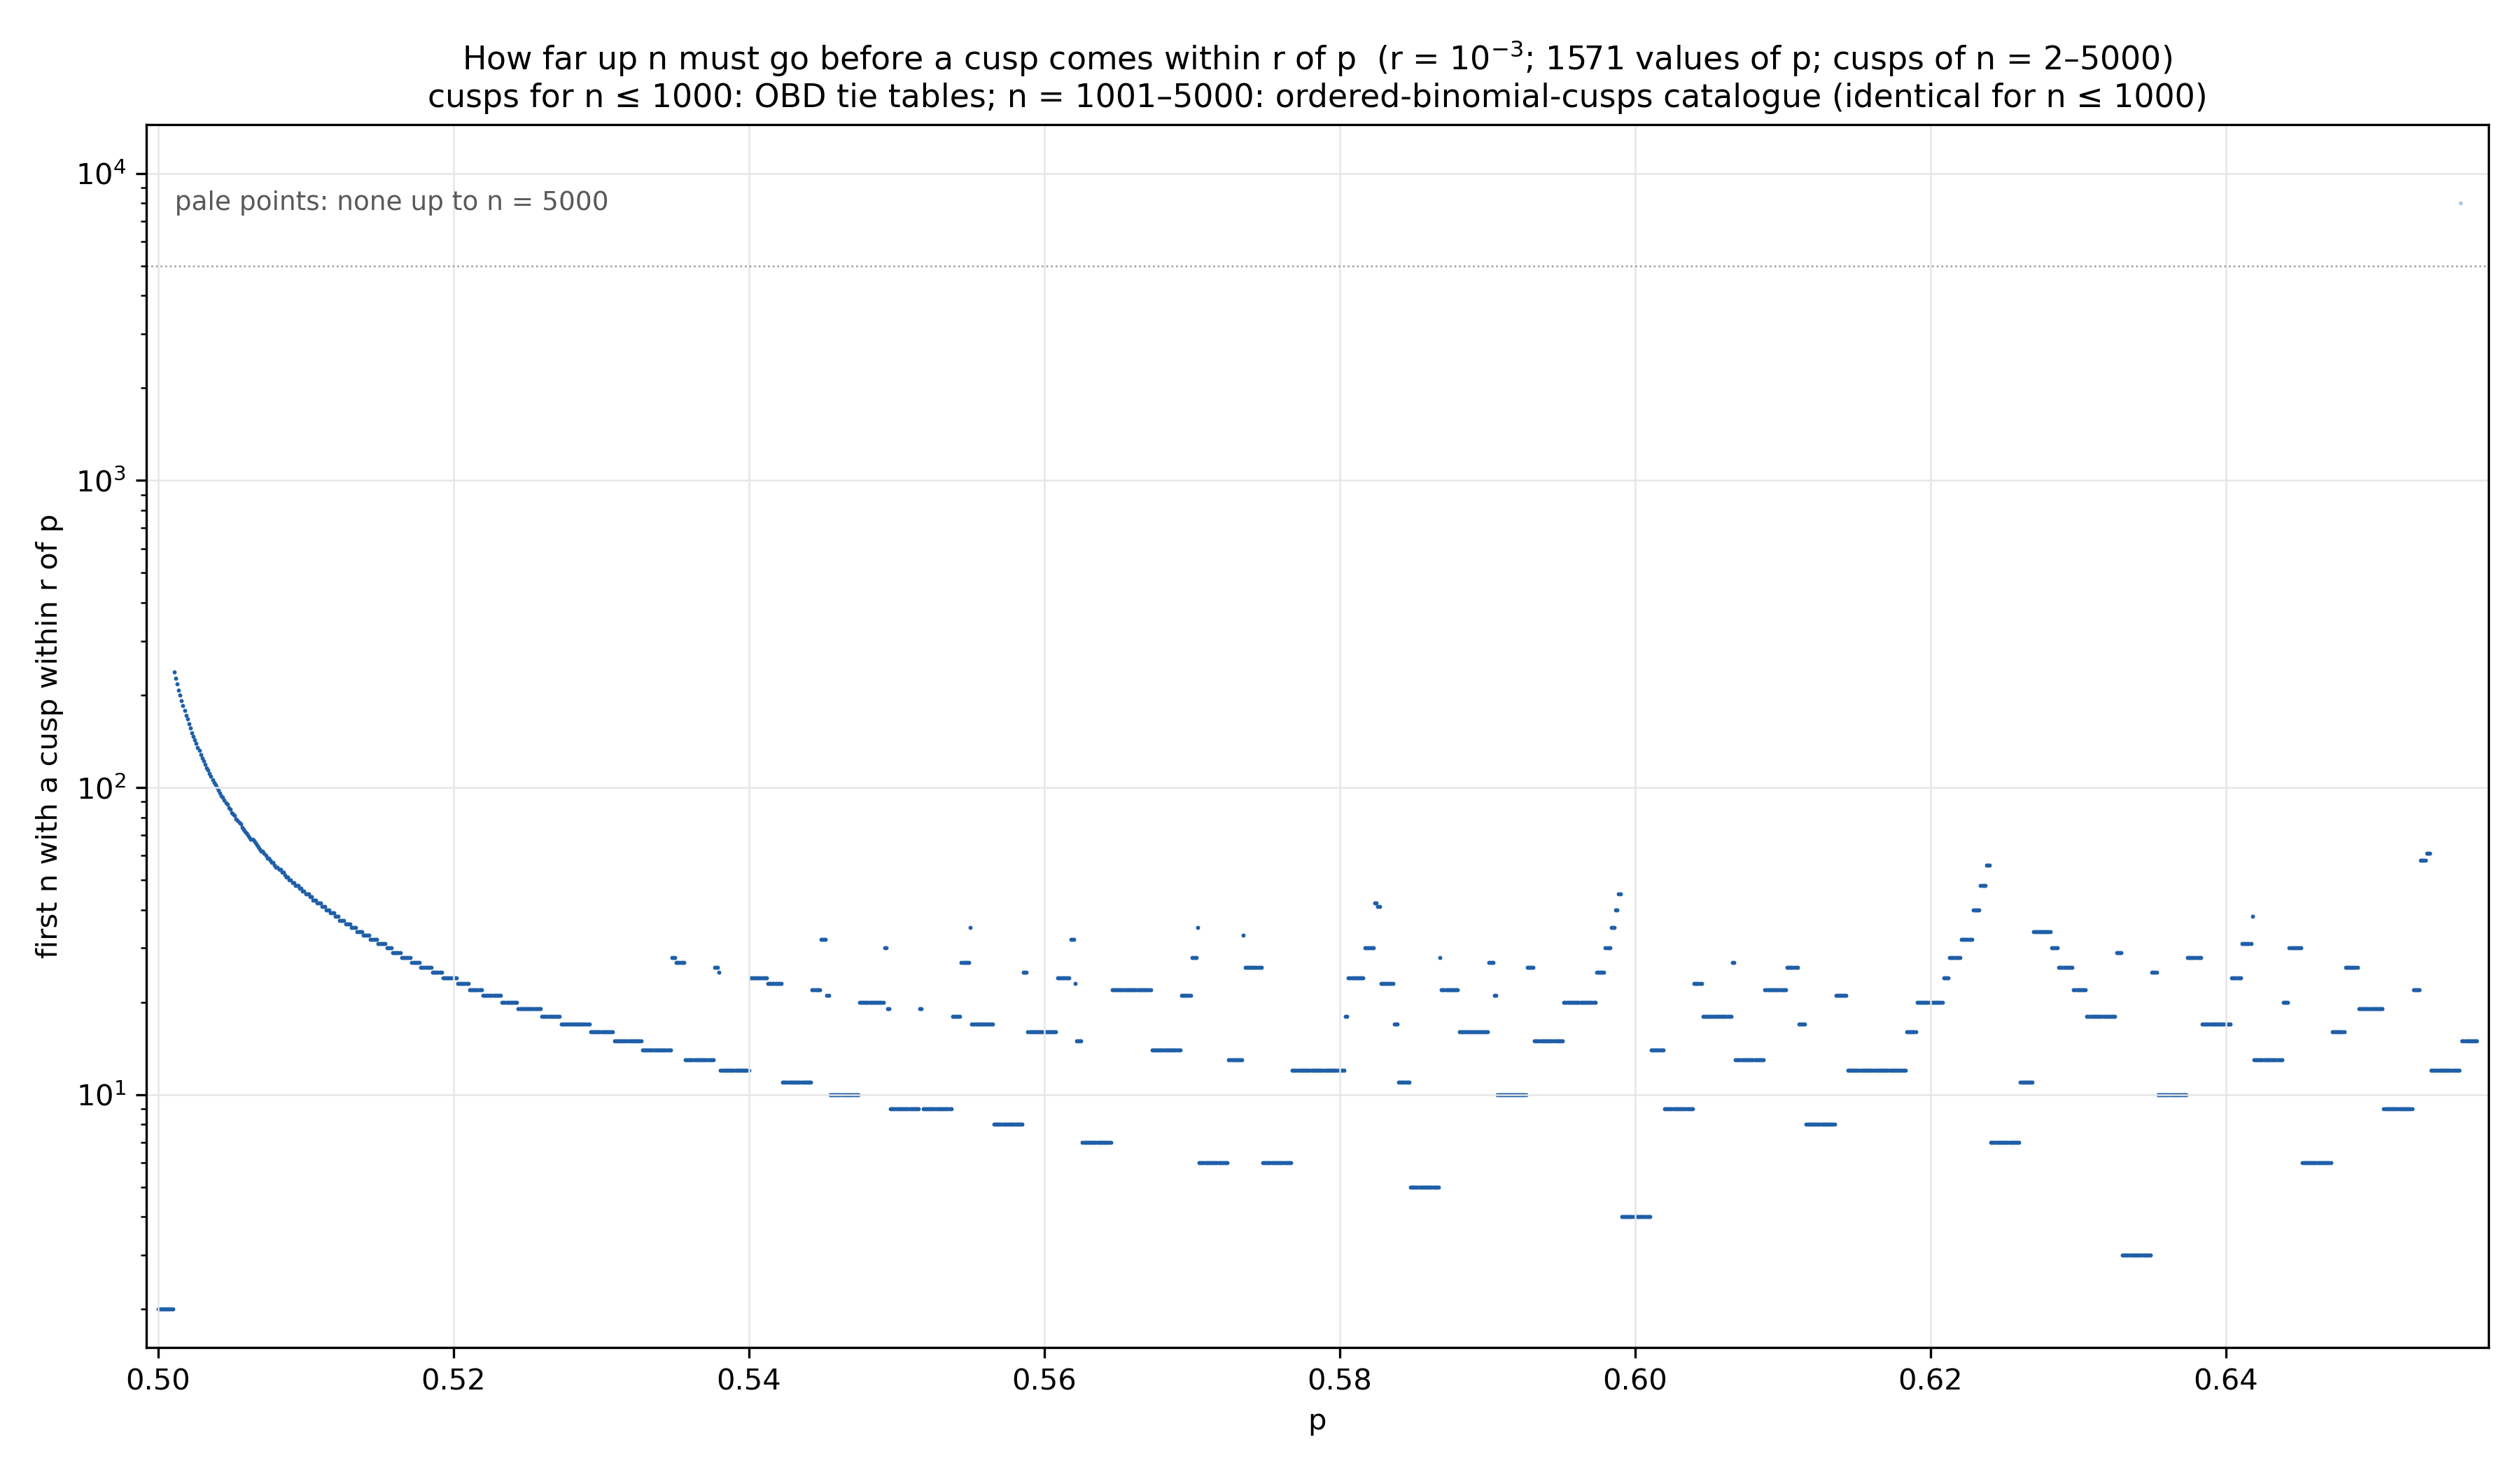
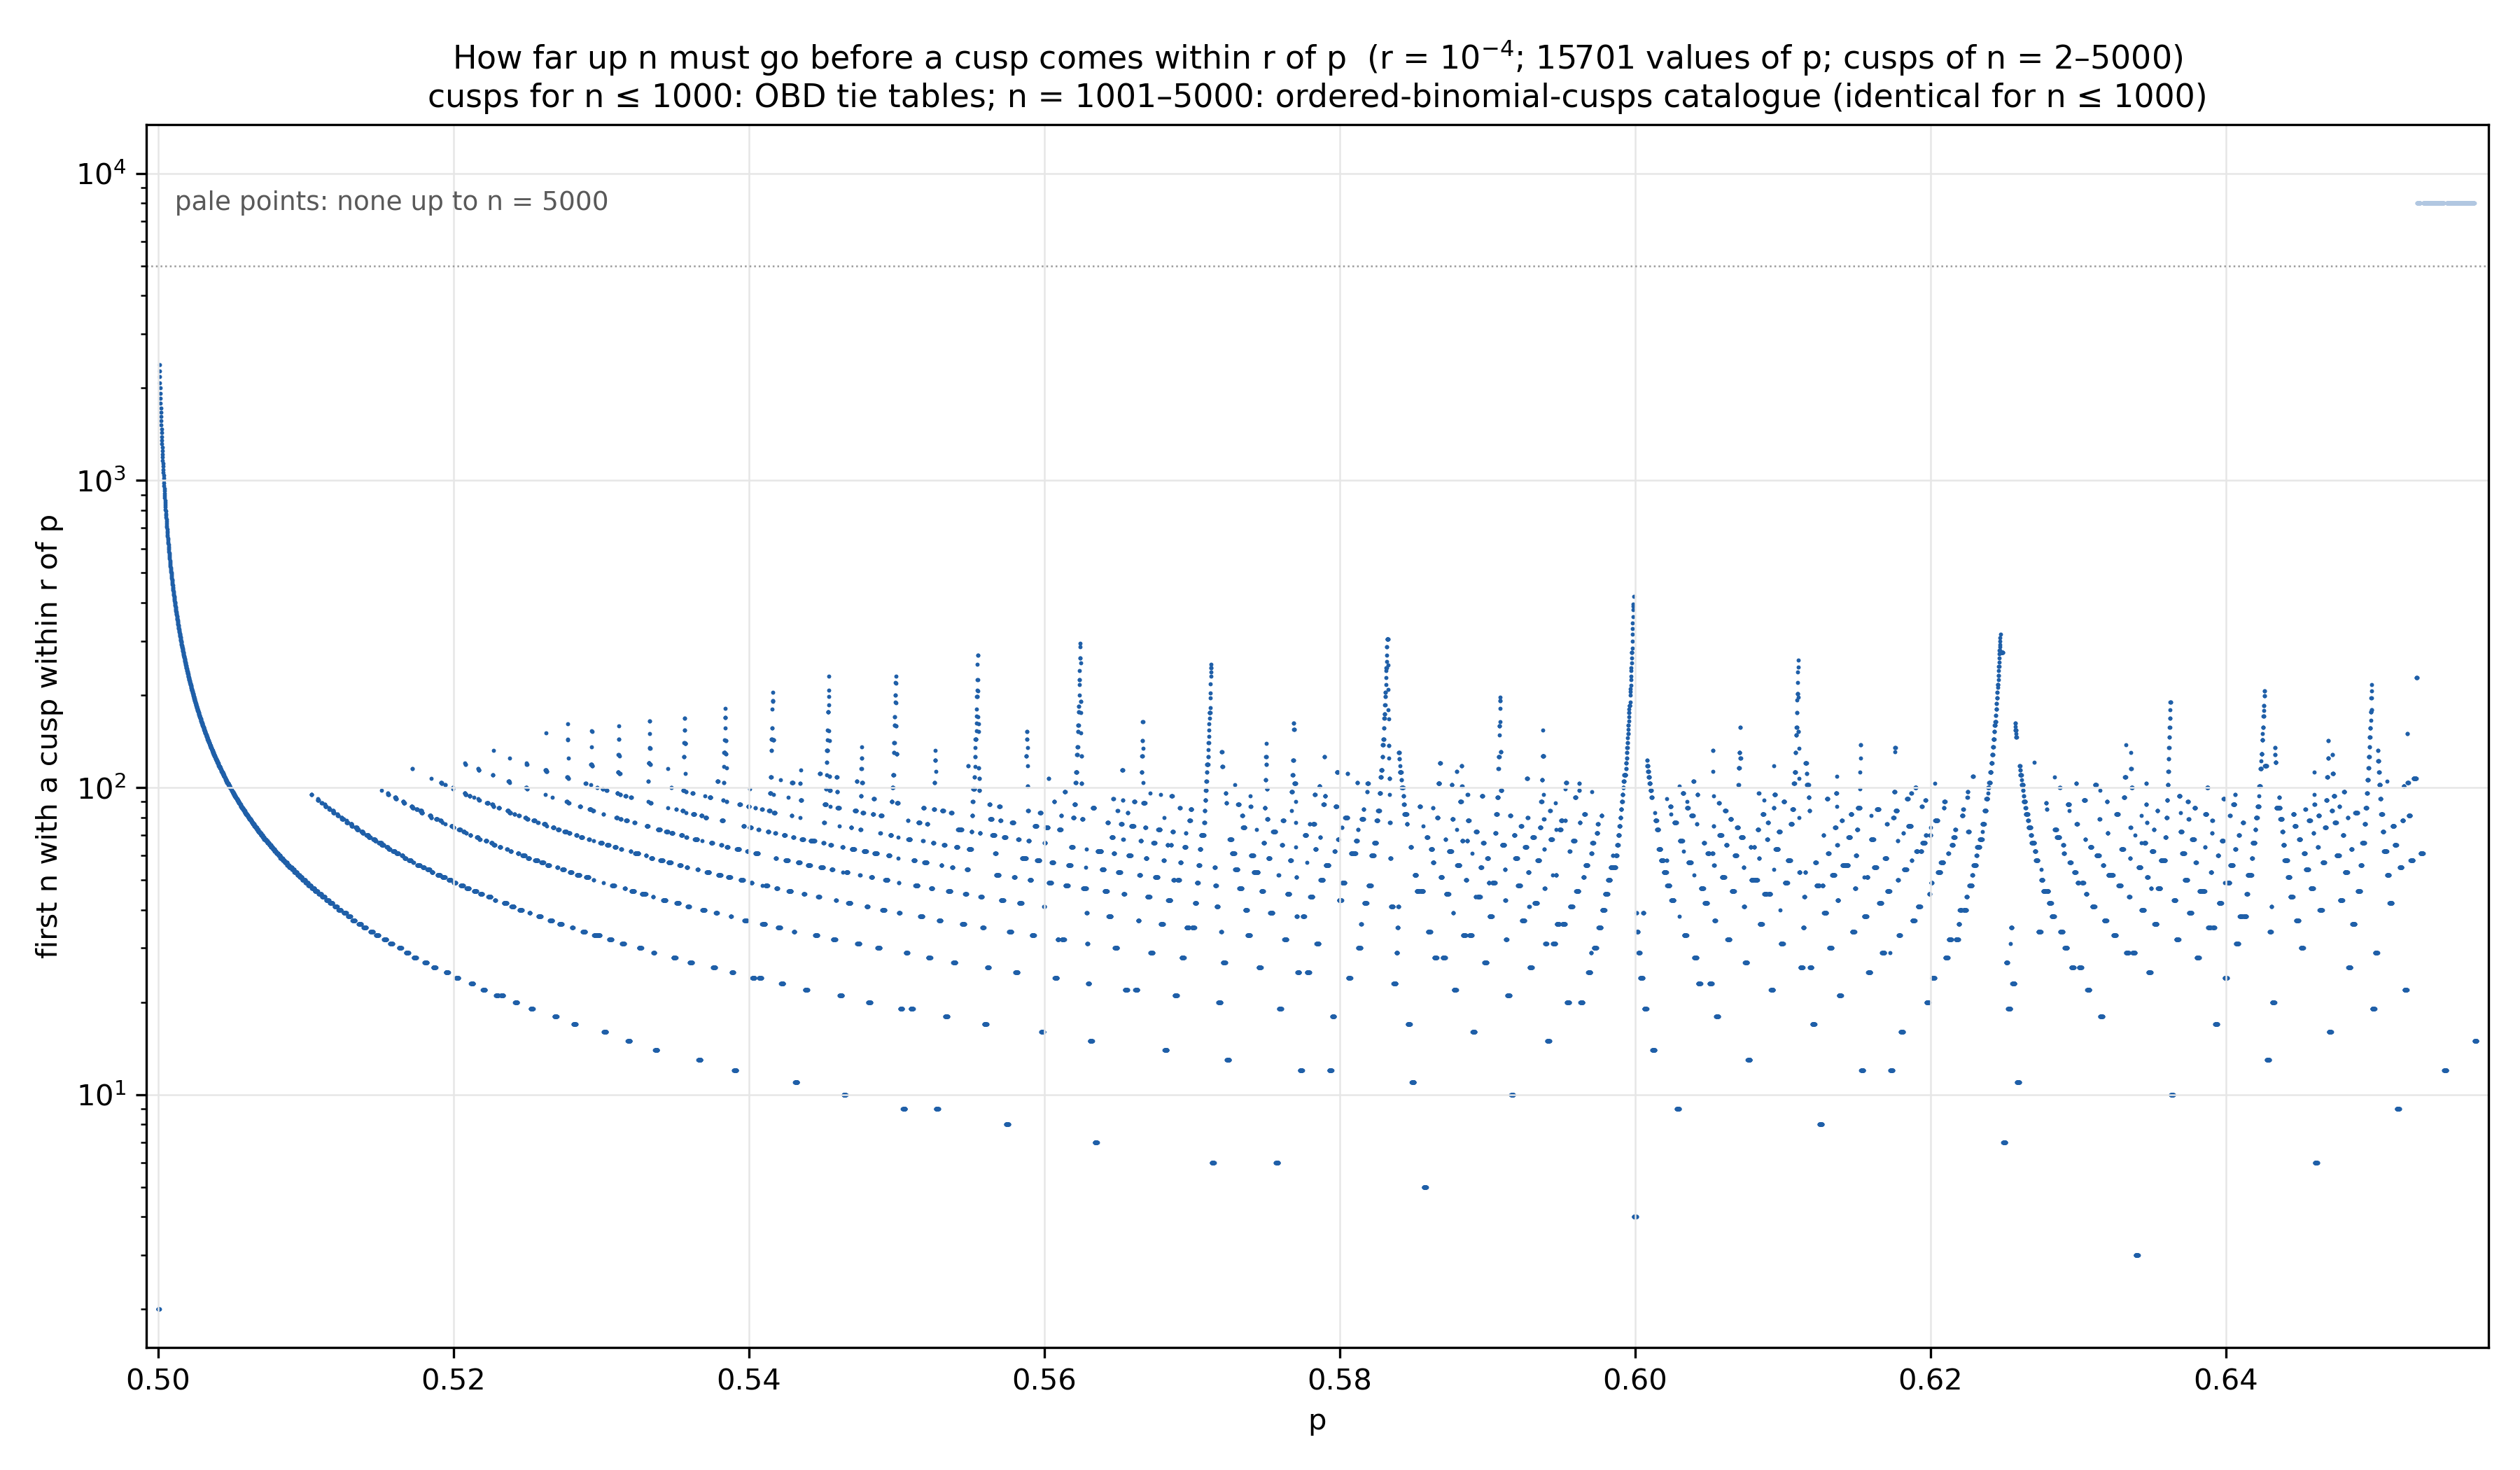
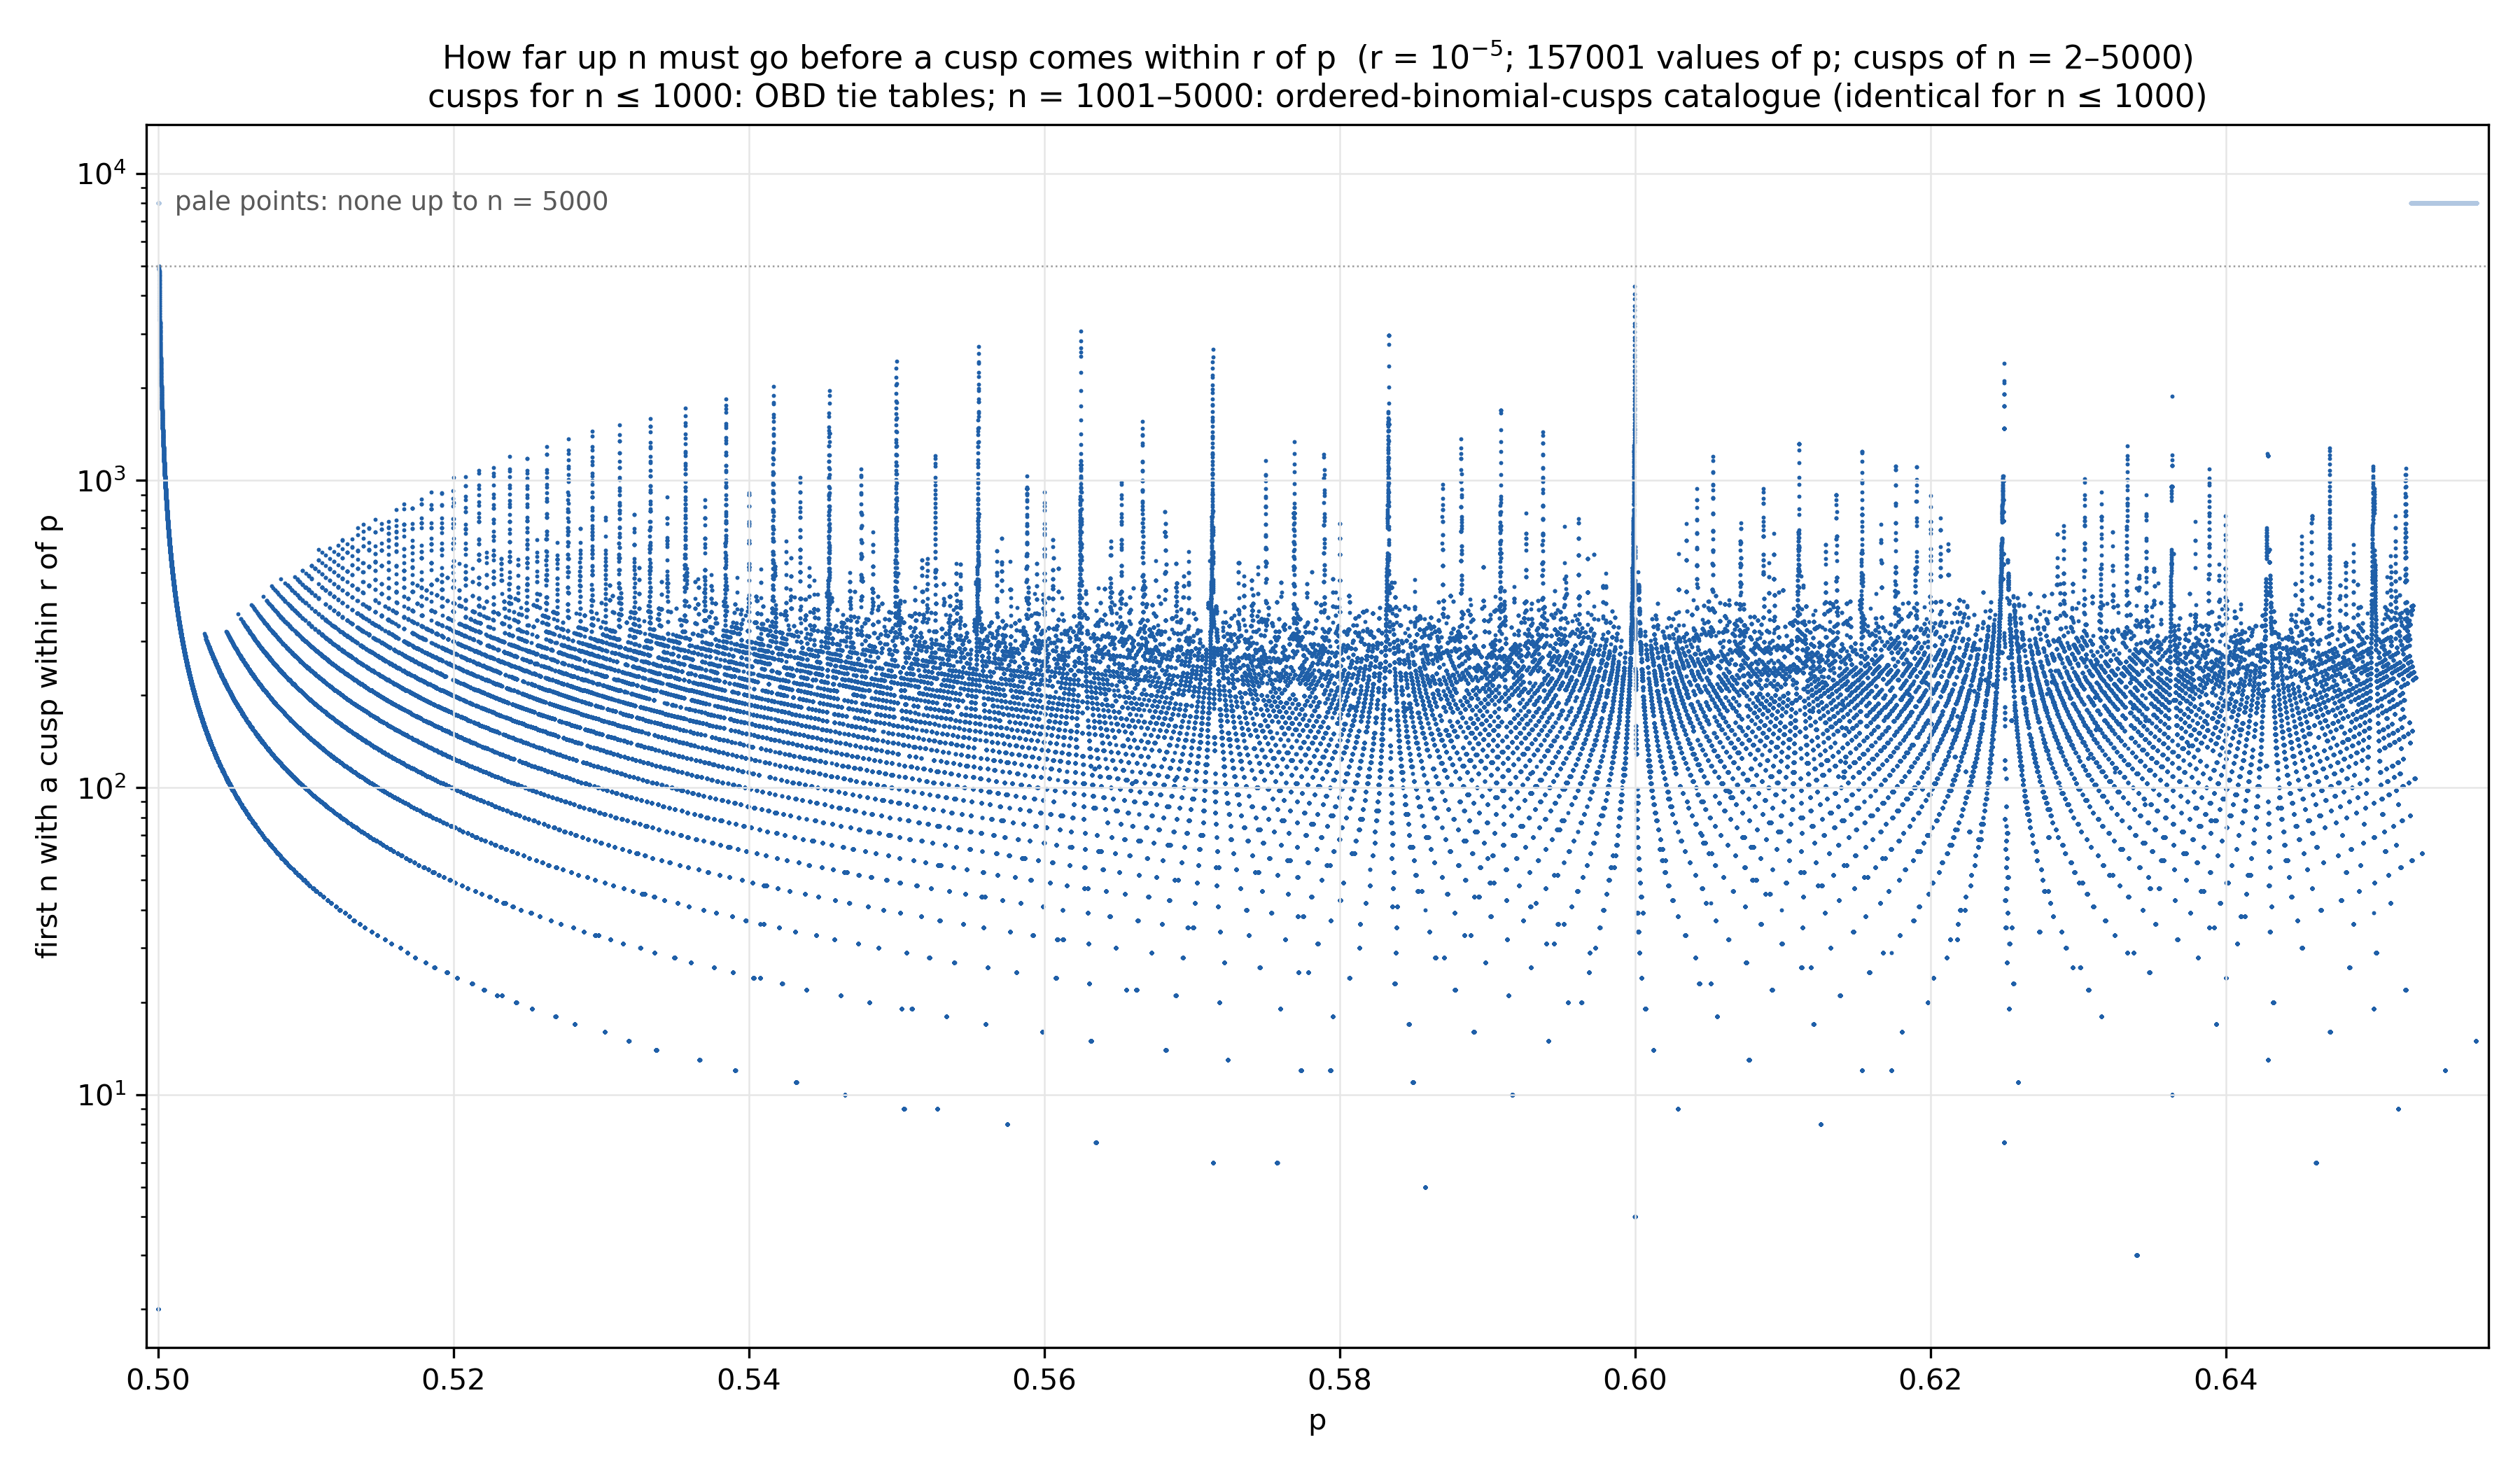
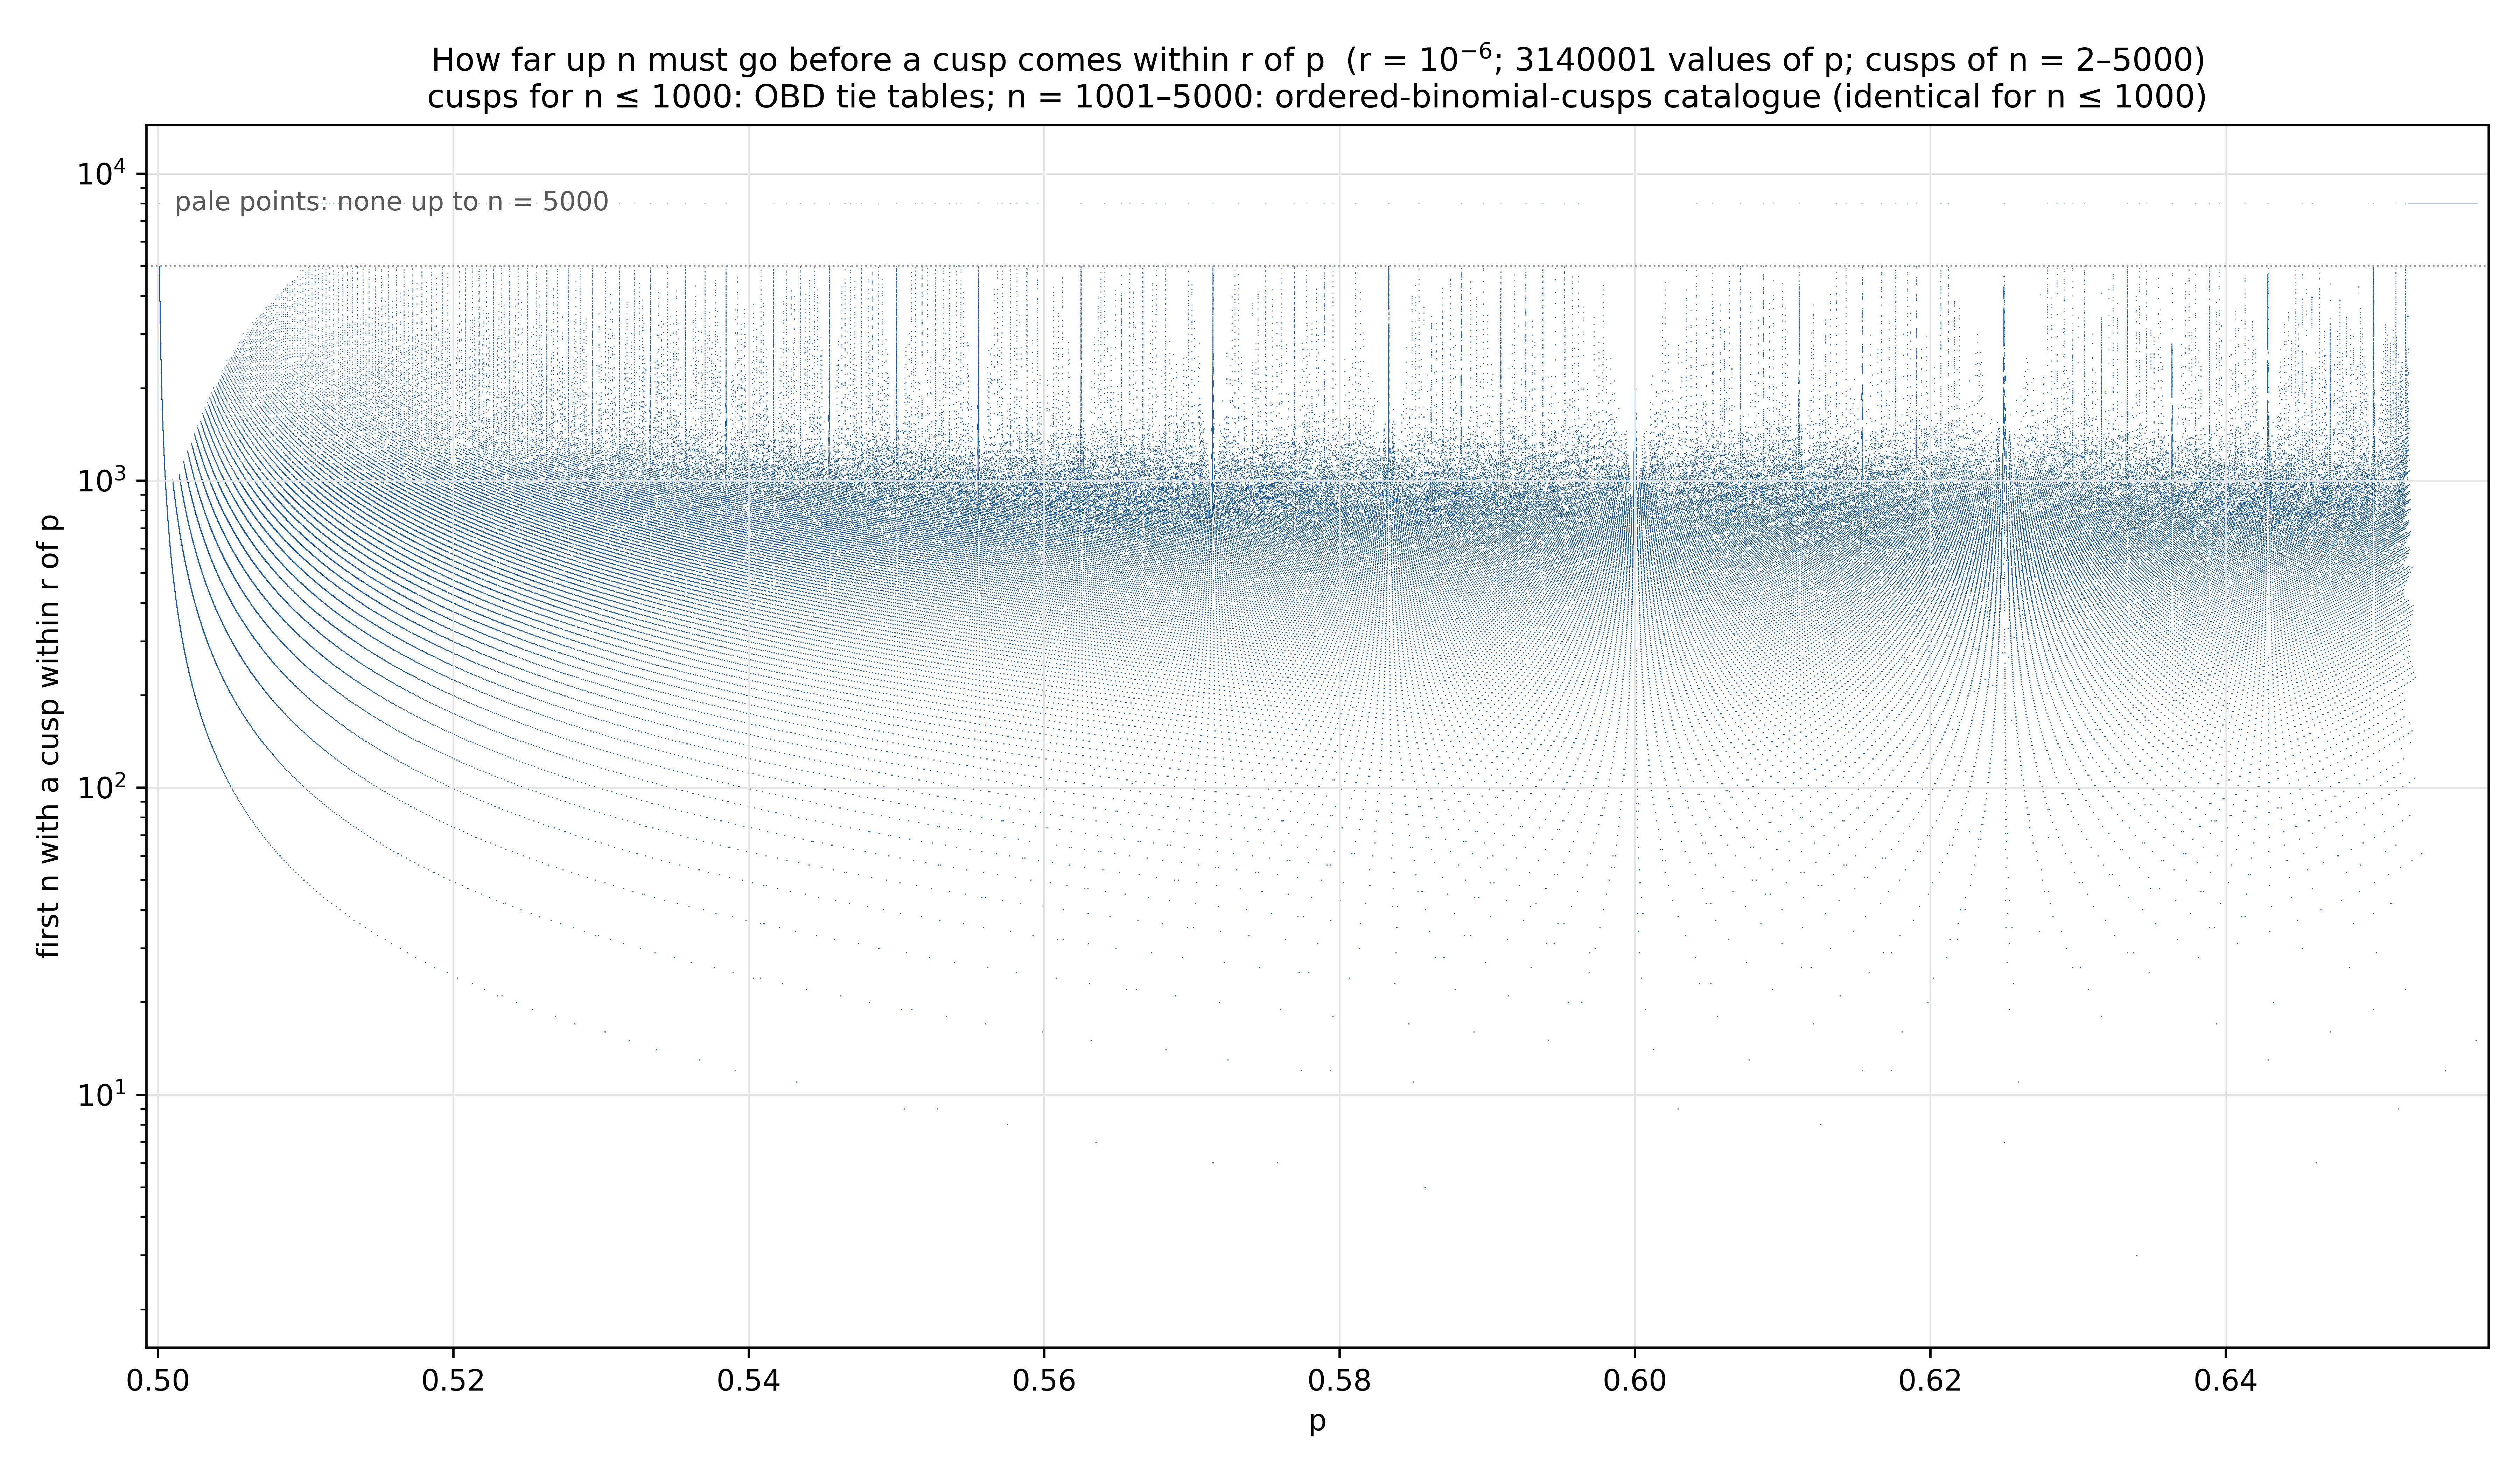
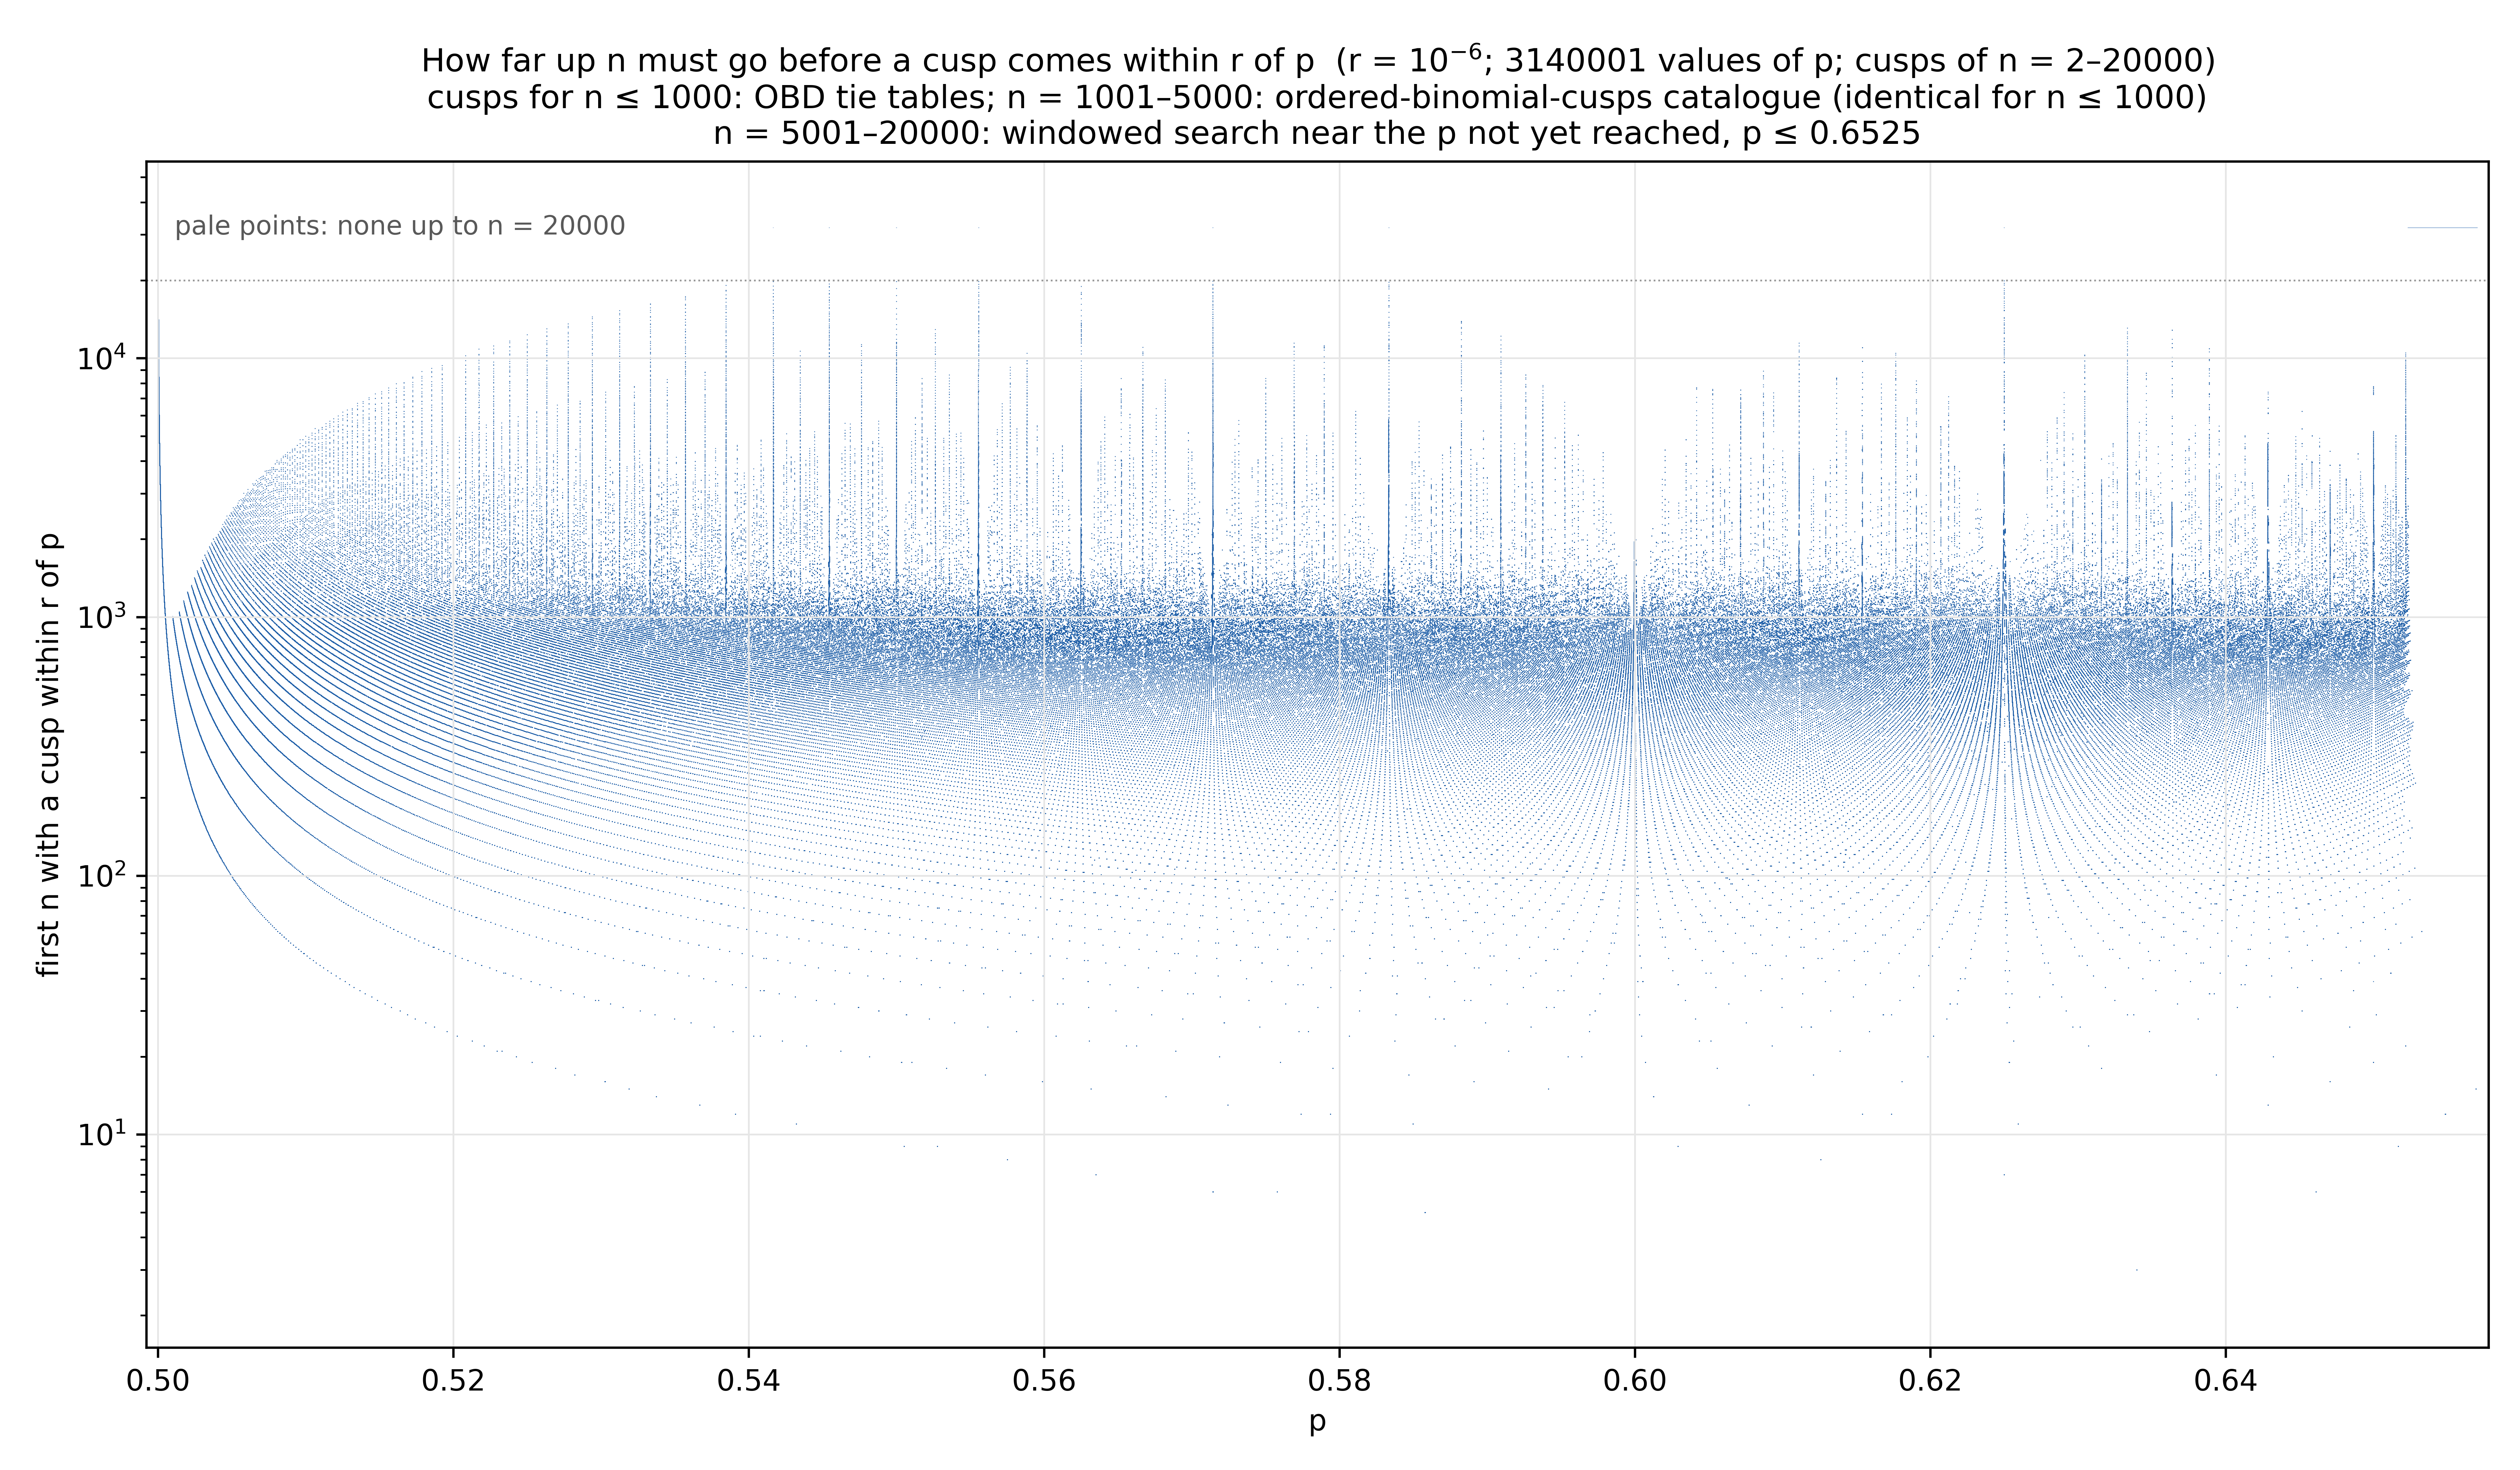
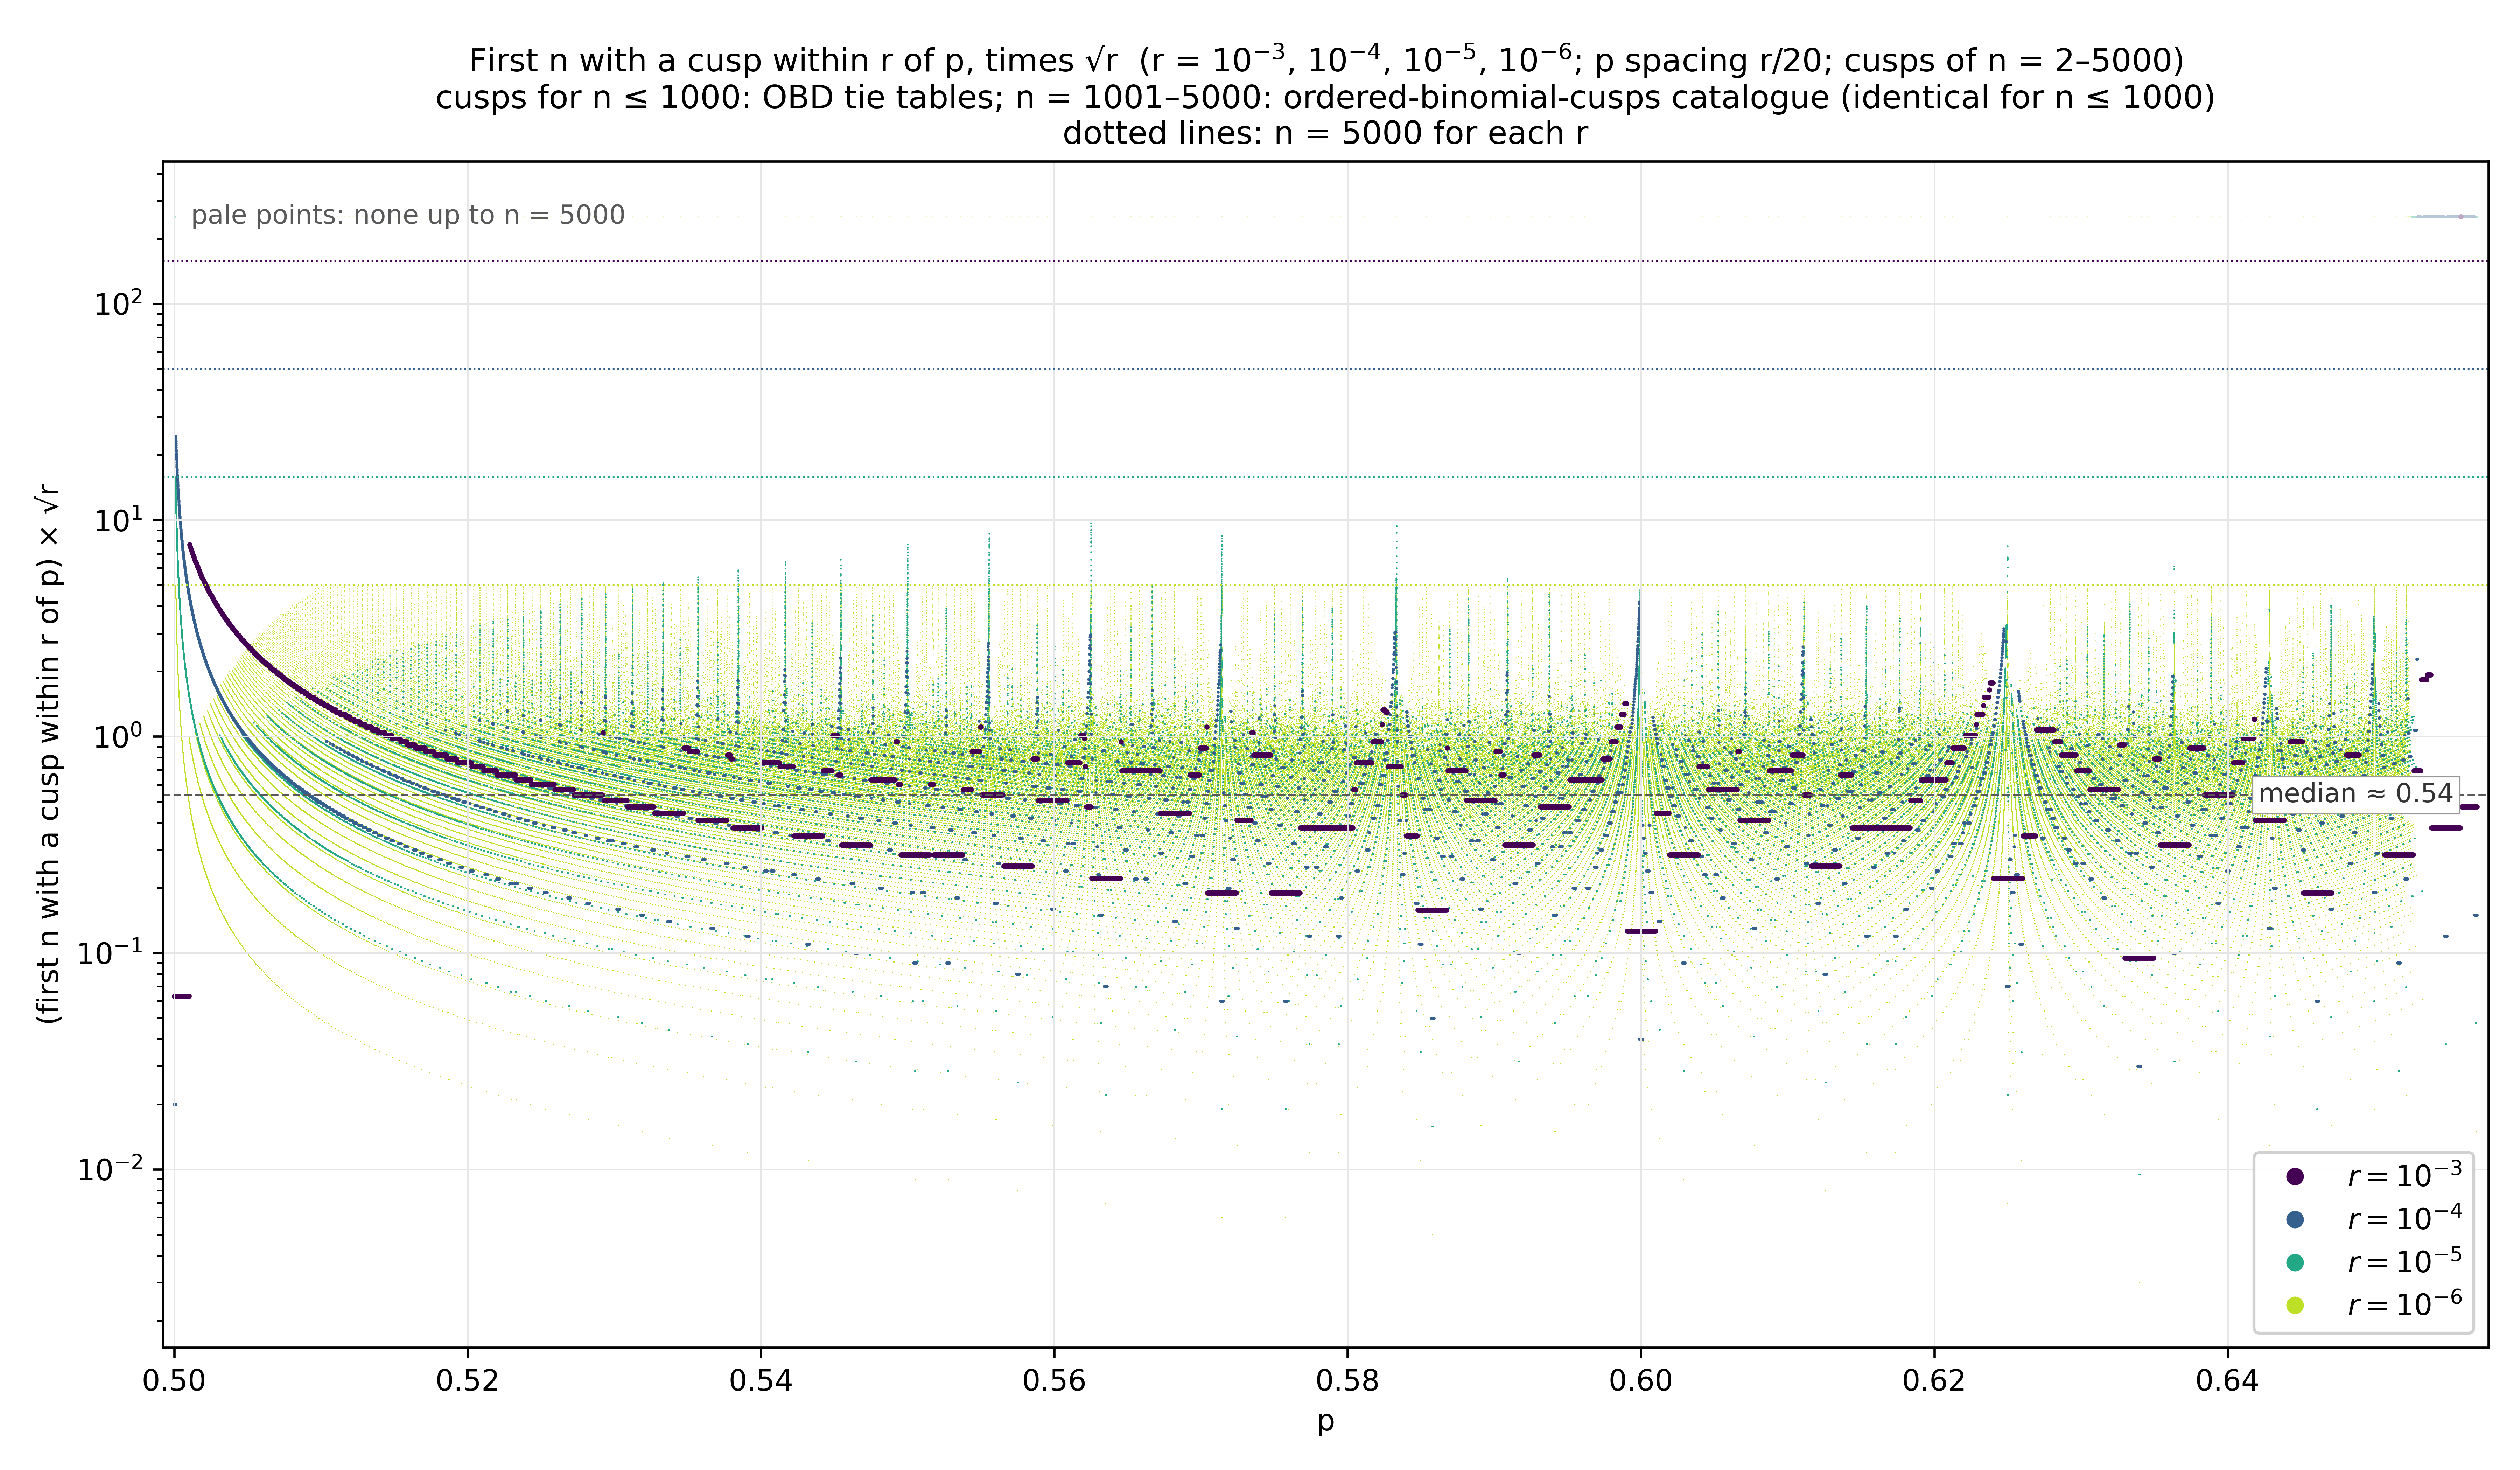
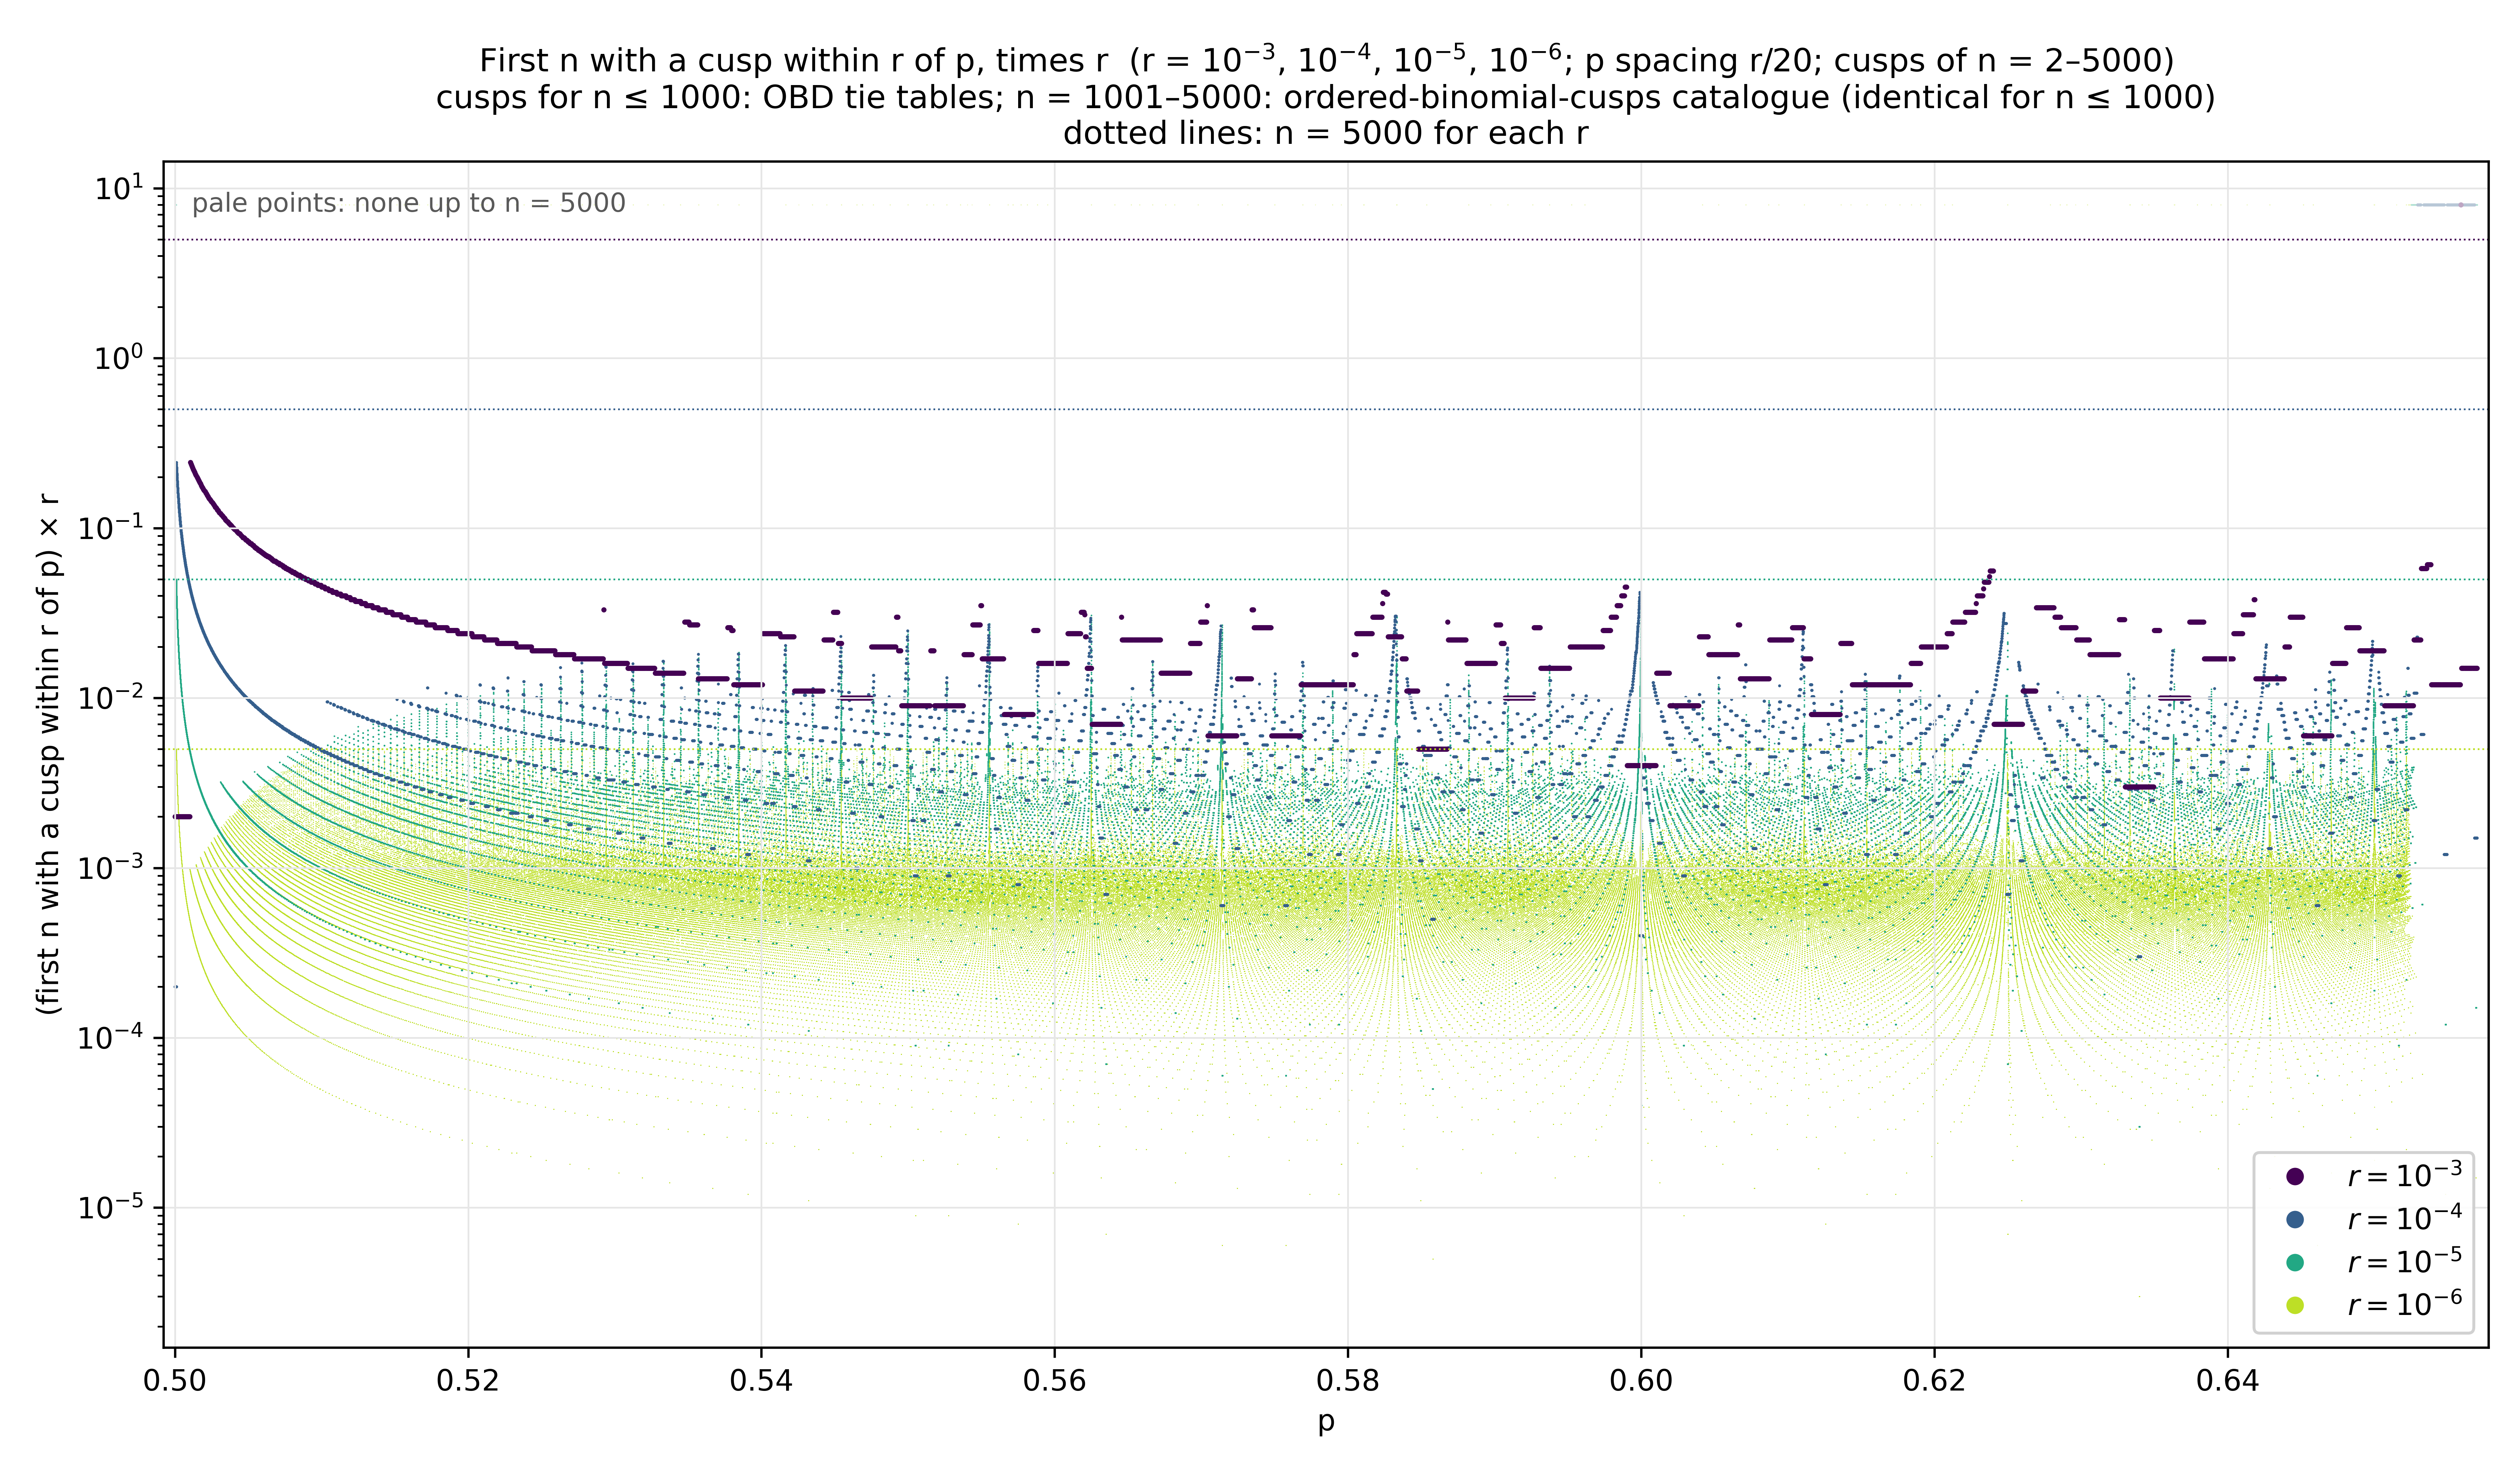
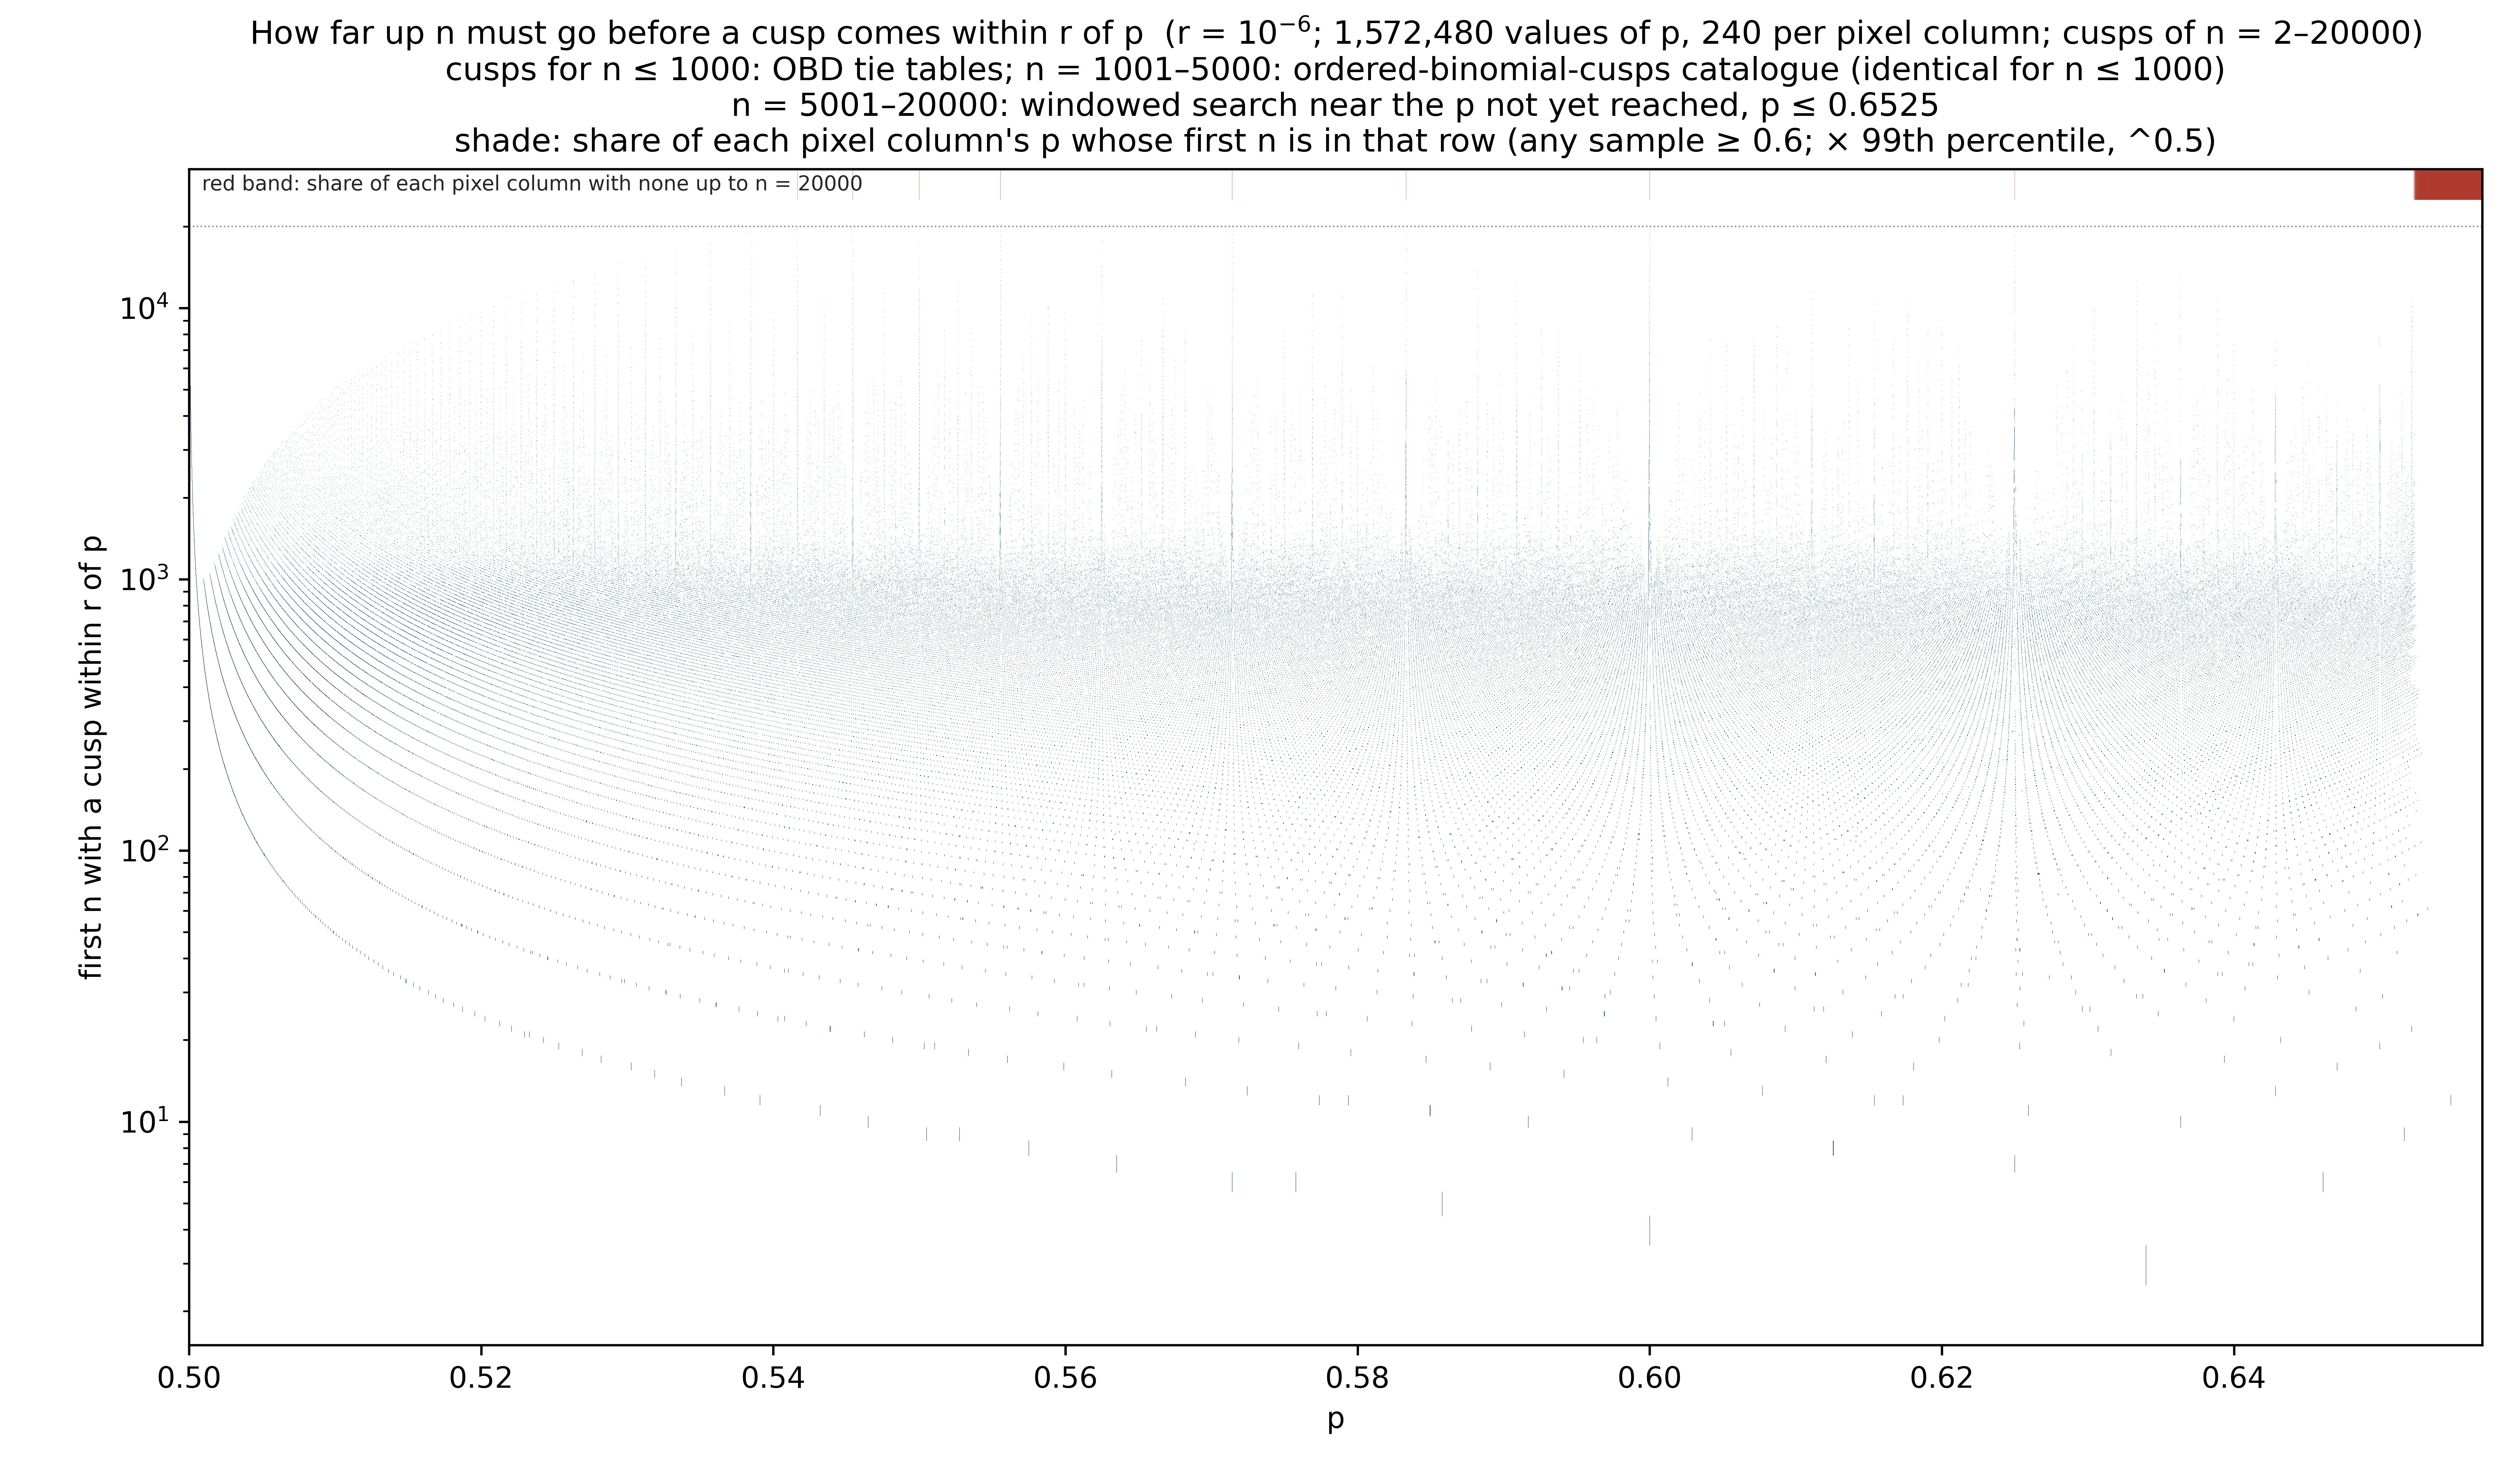
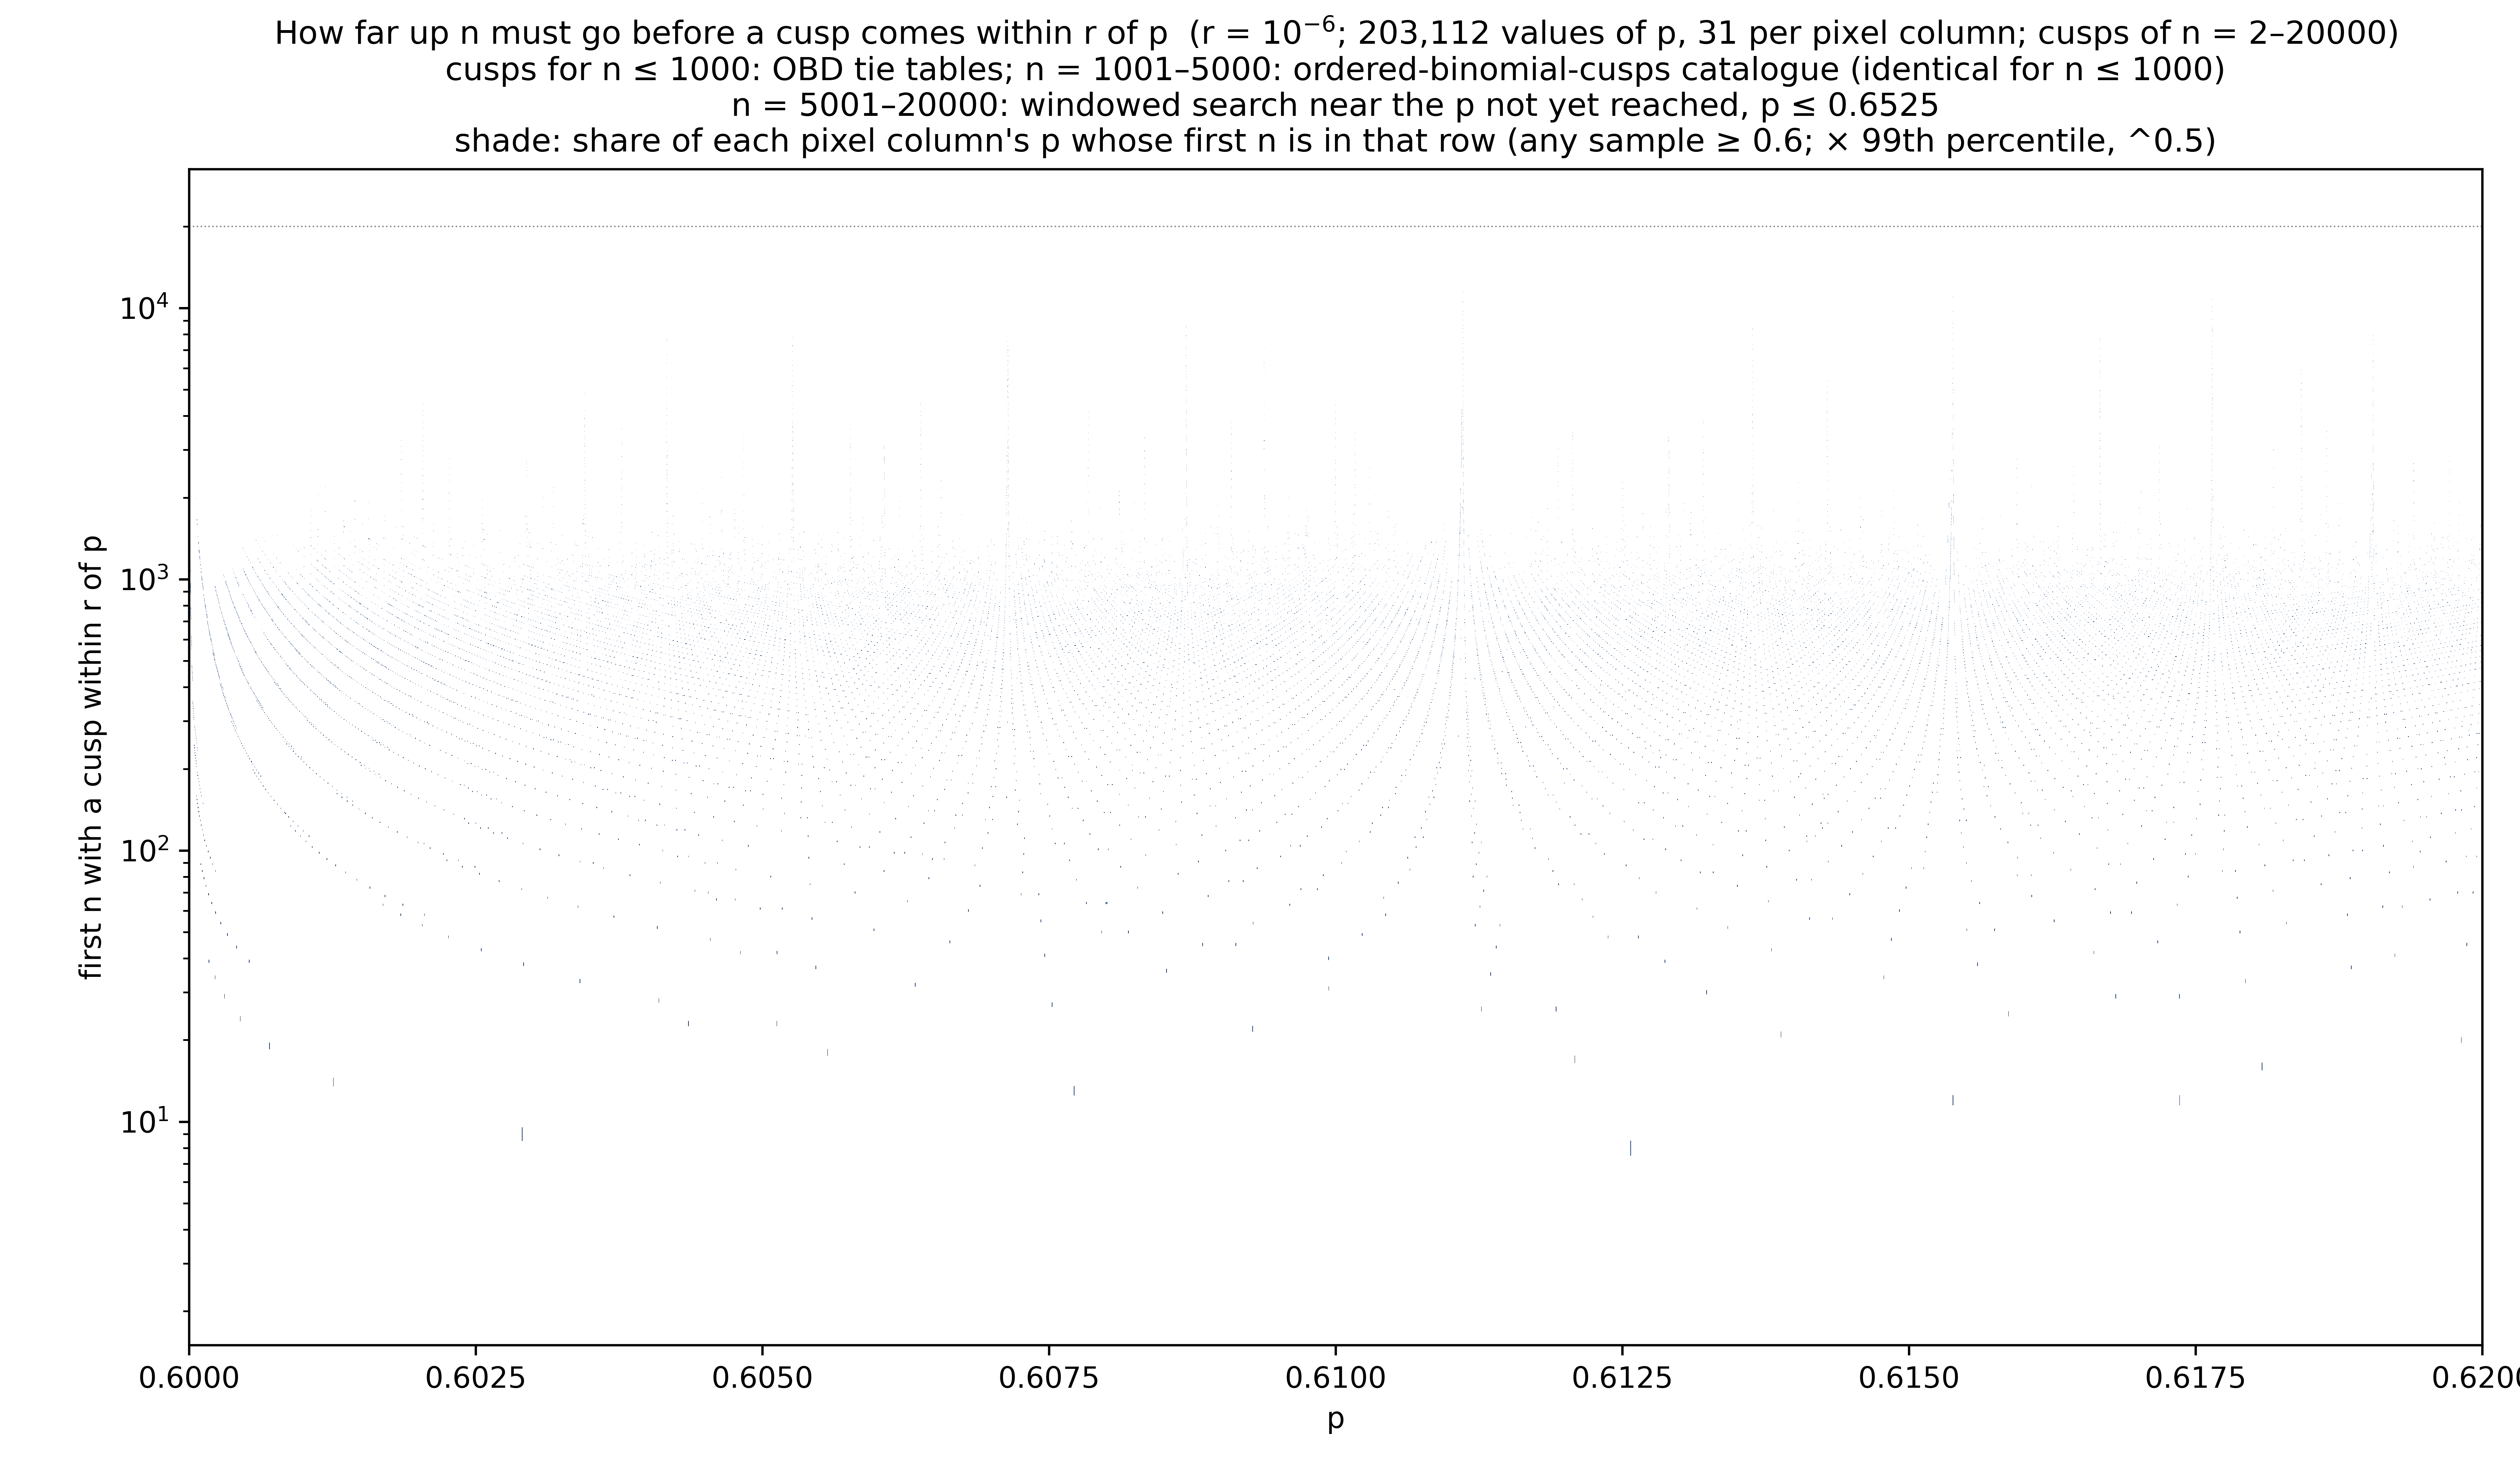
- First n with a cusp within r of p: r = 0.001, r = 0.0001, r = 0.00001, r = 0.000001 (searched on to n = 20000); all four, scaled by √r, scaled by r
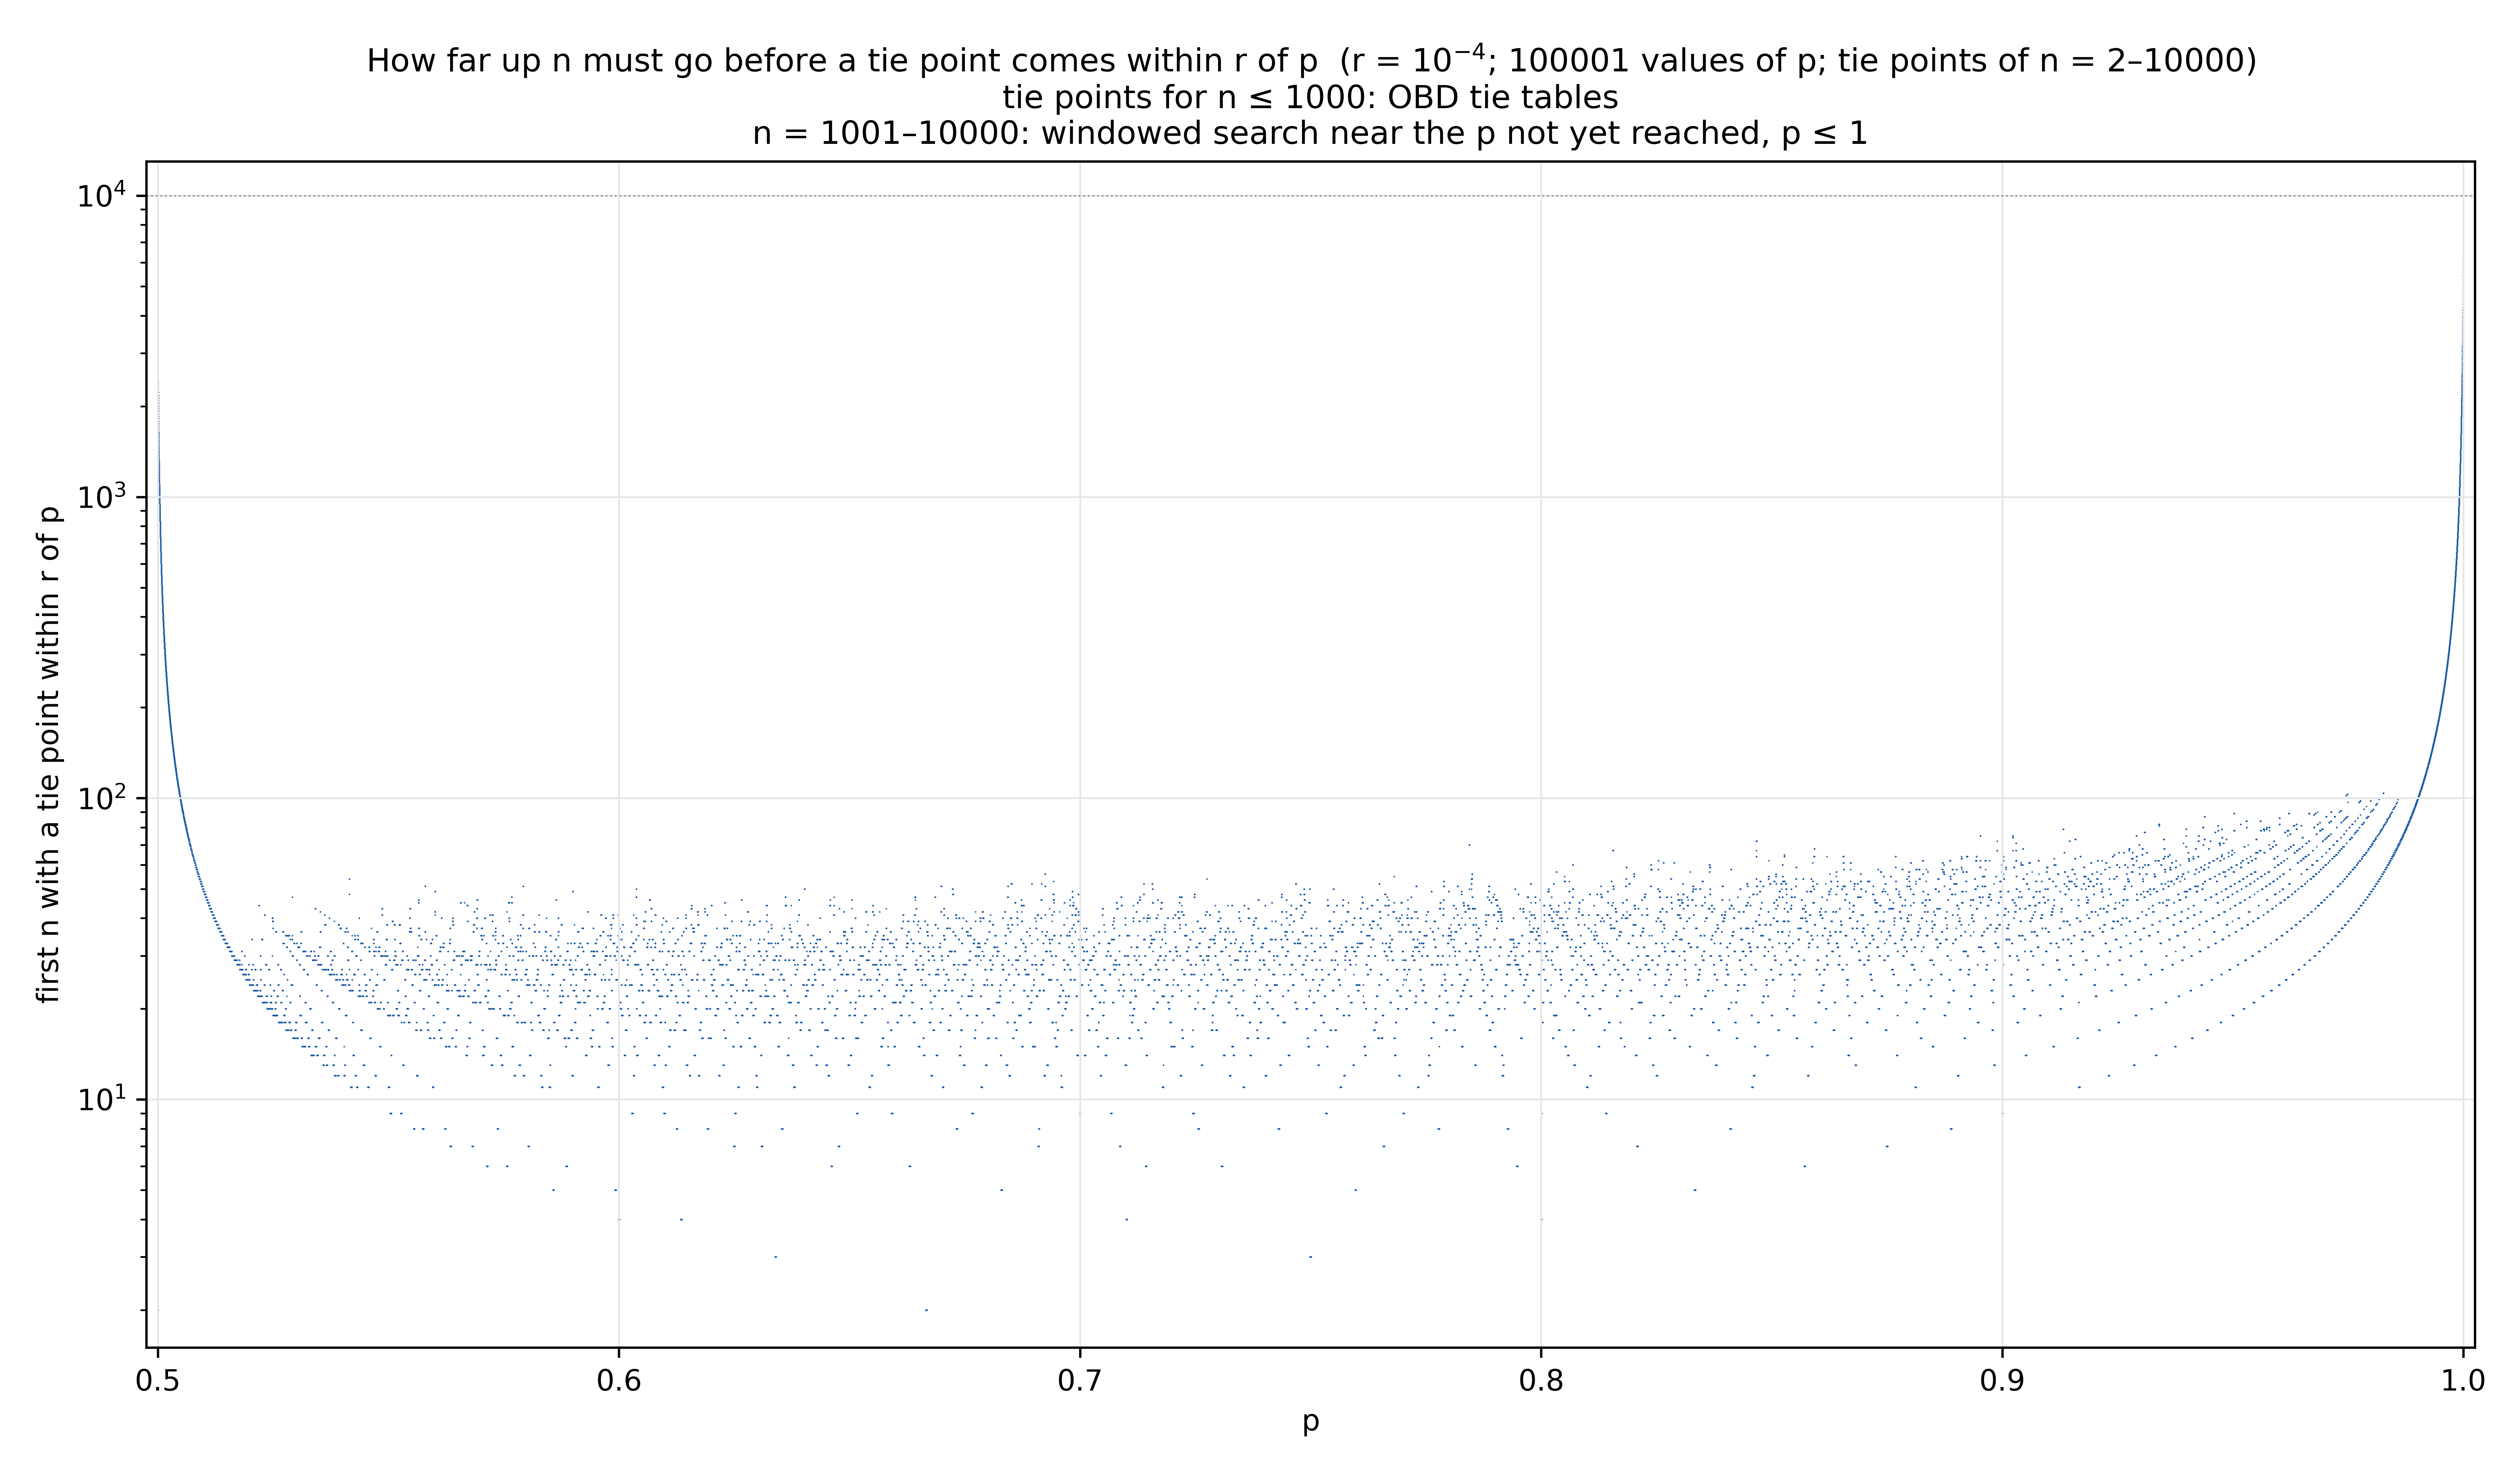
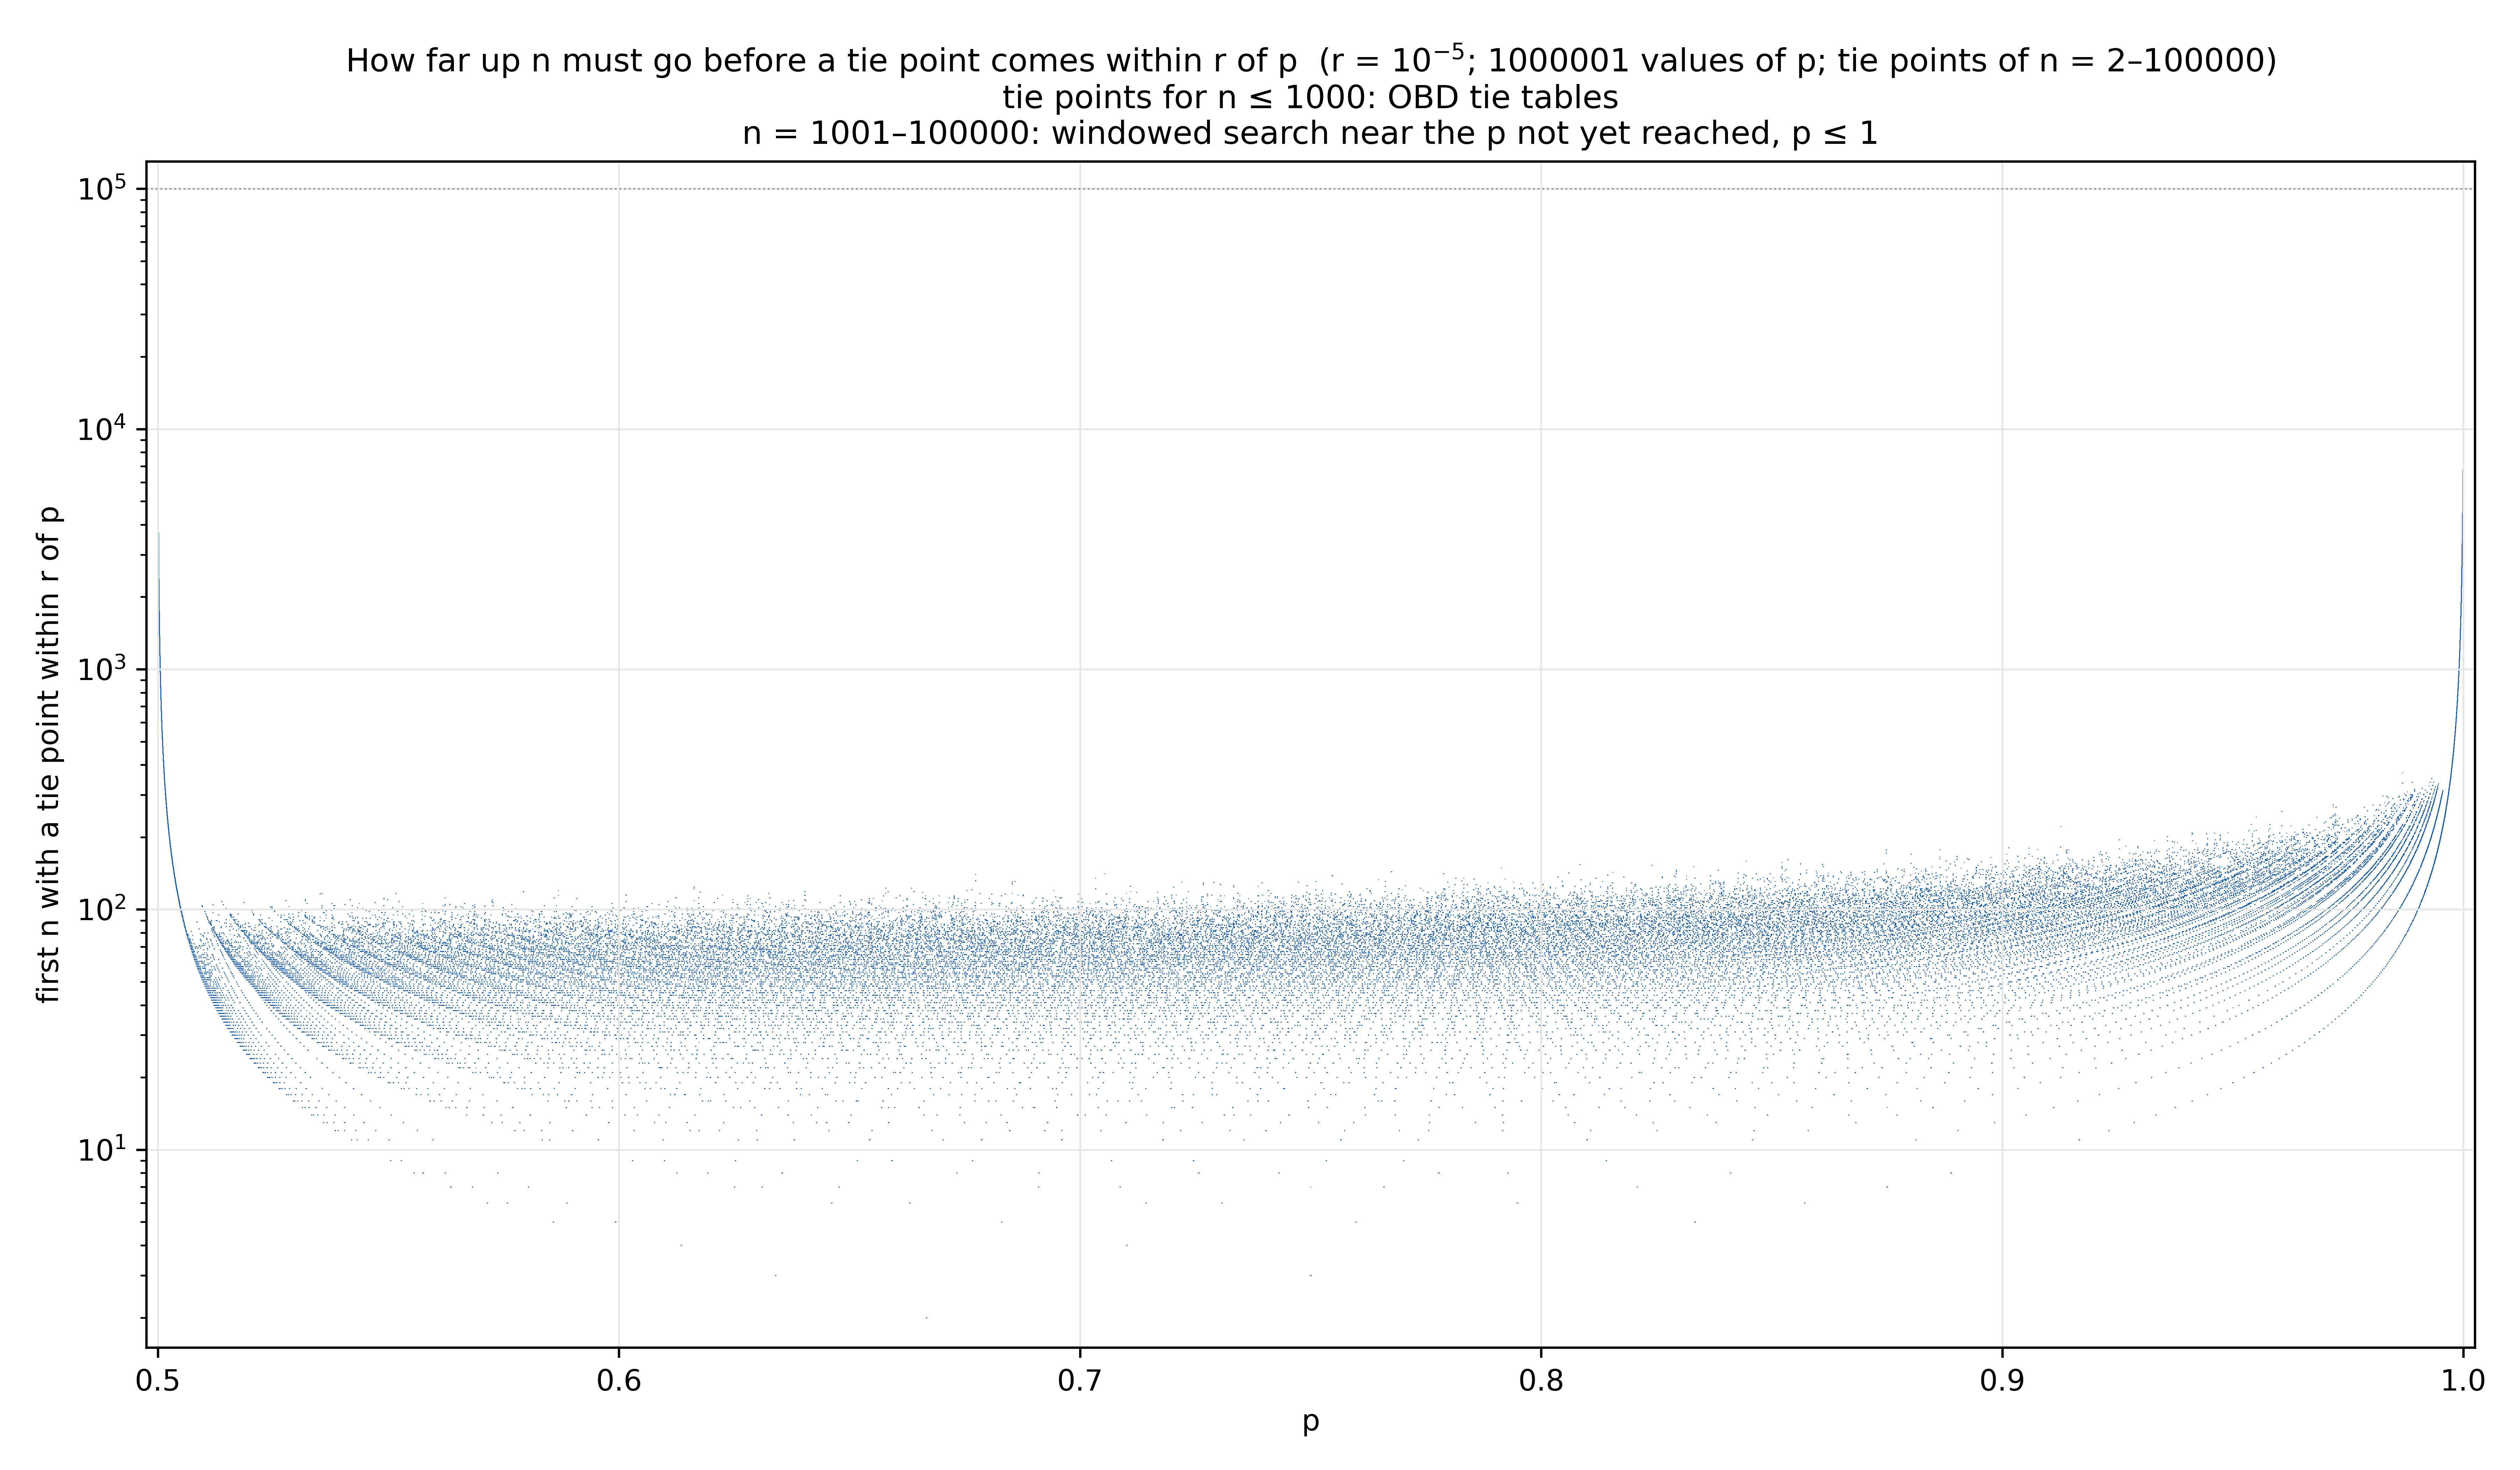
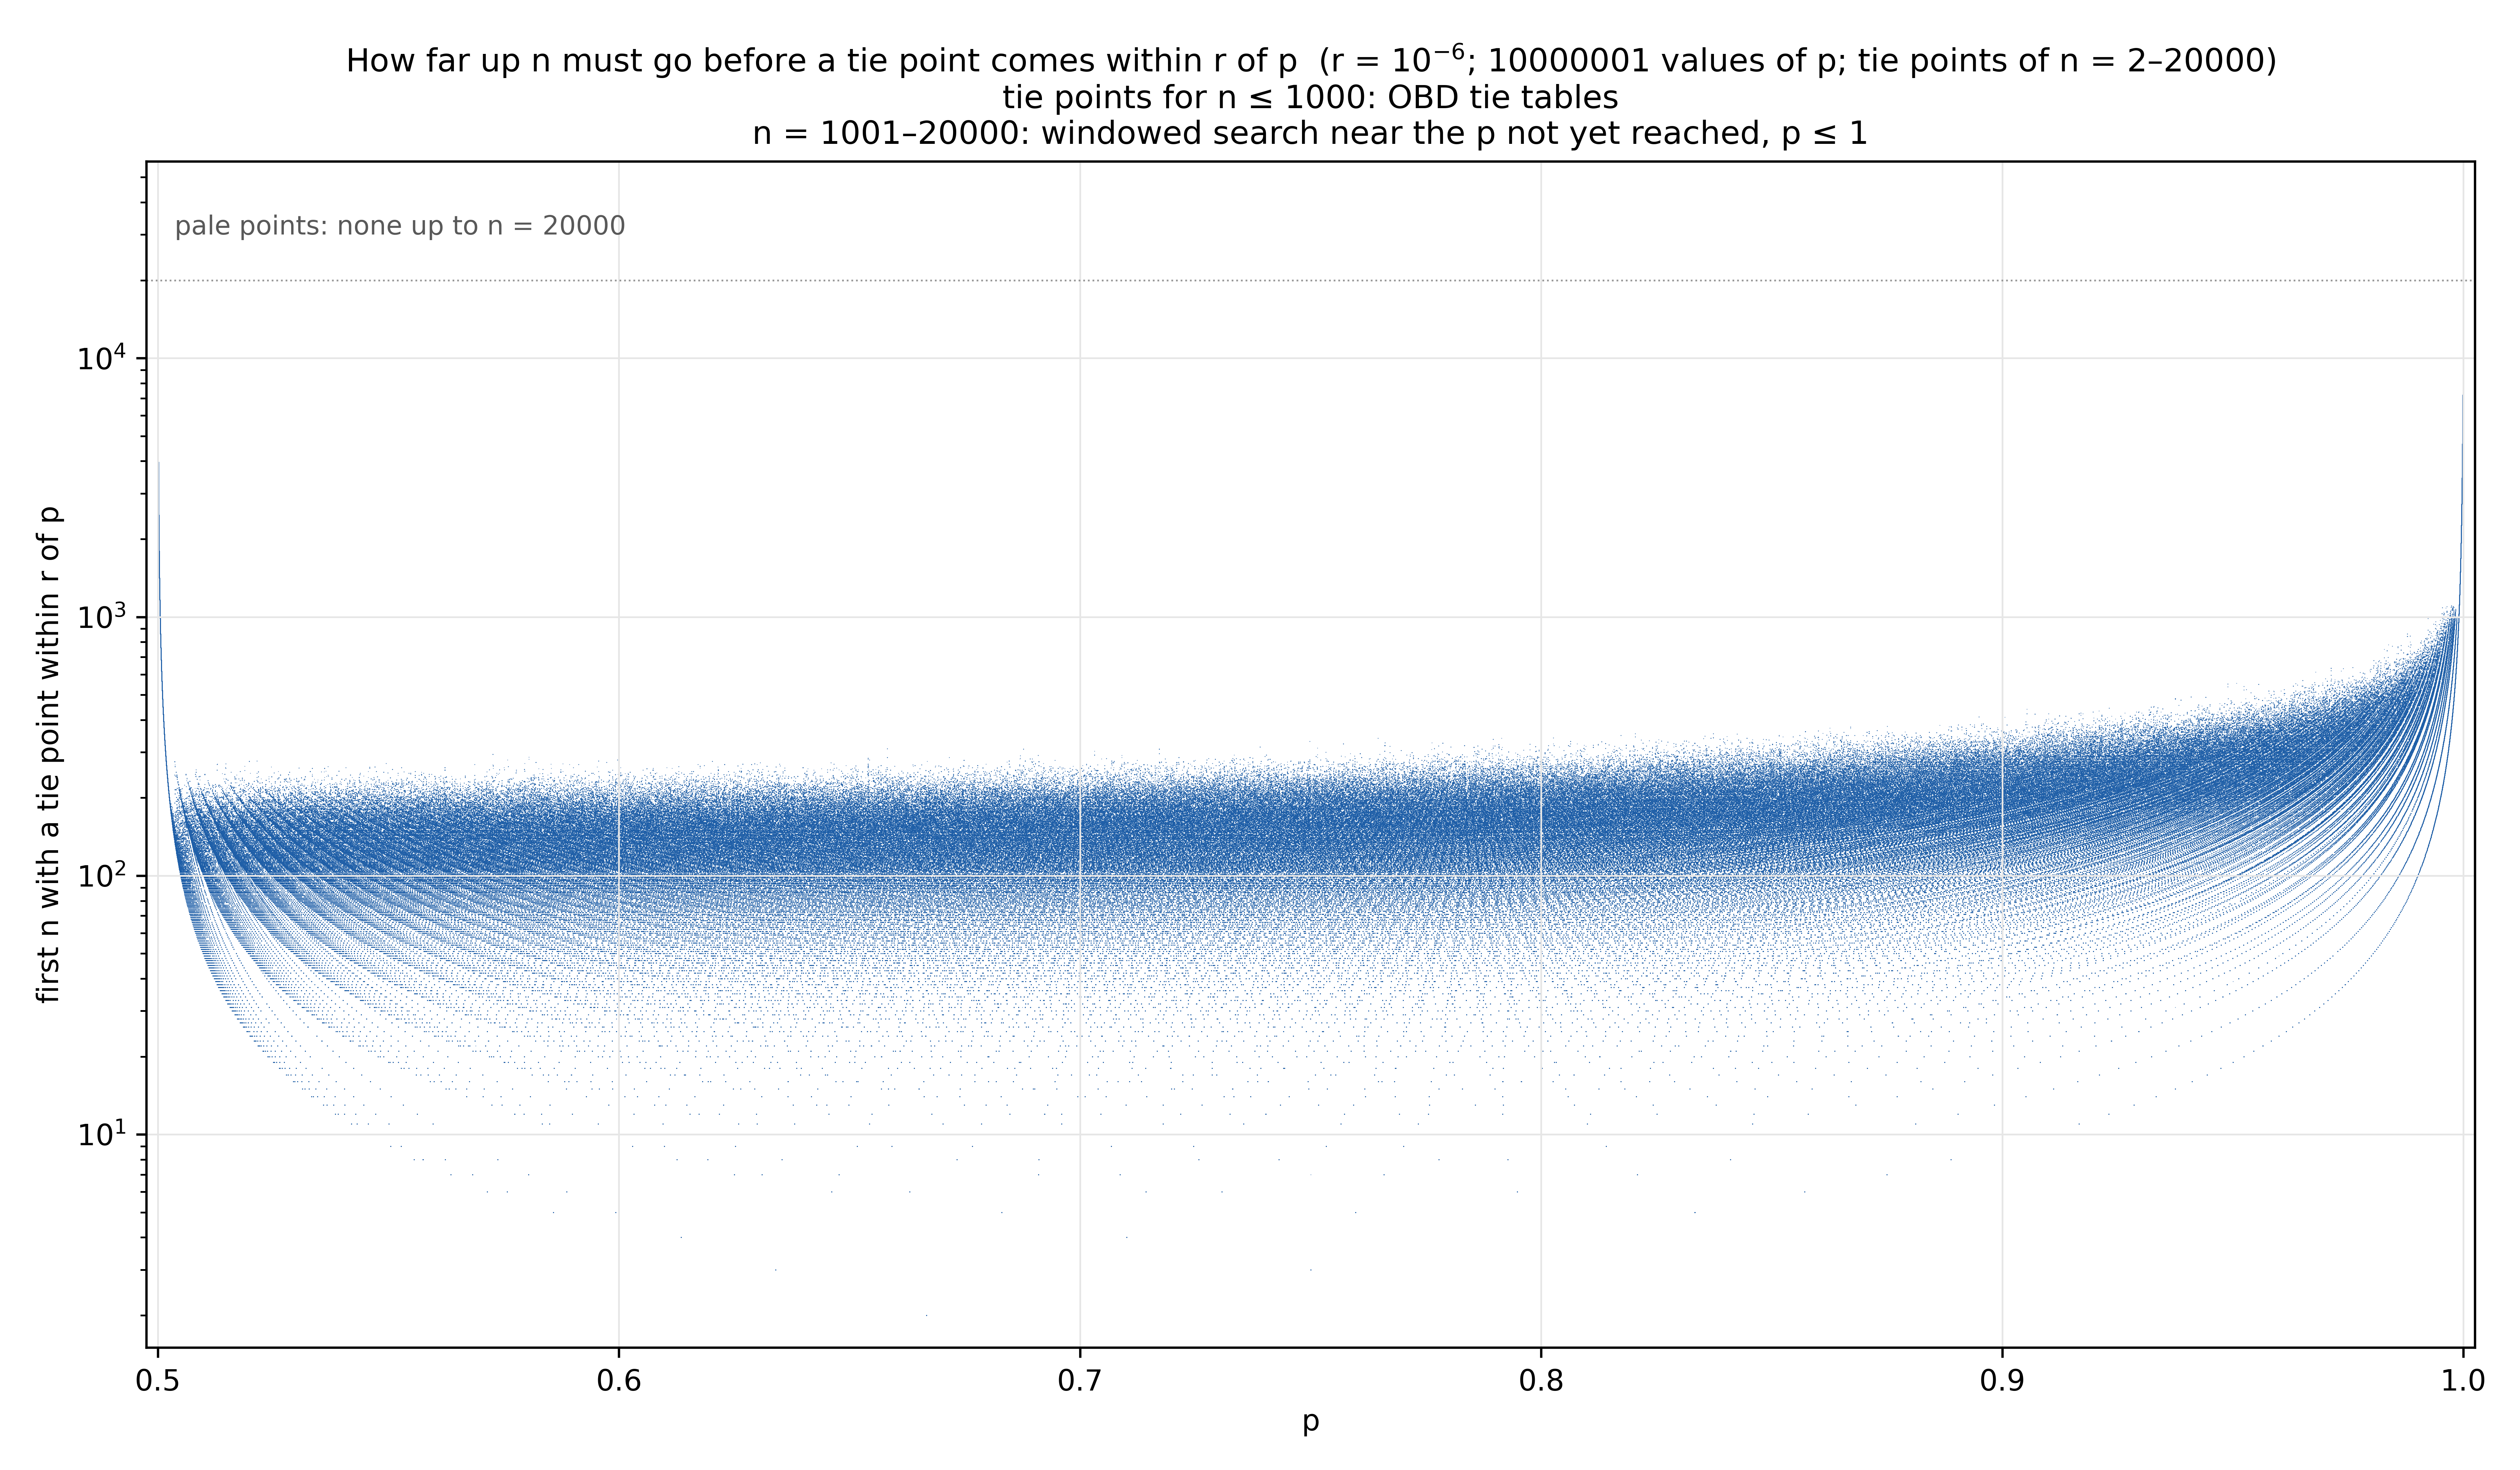
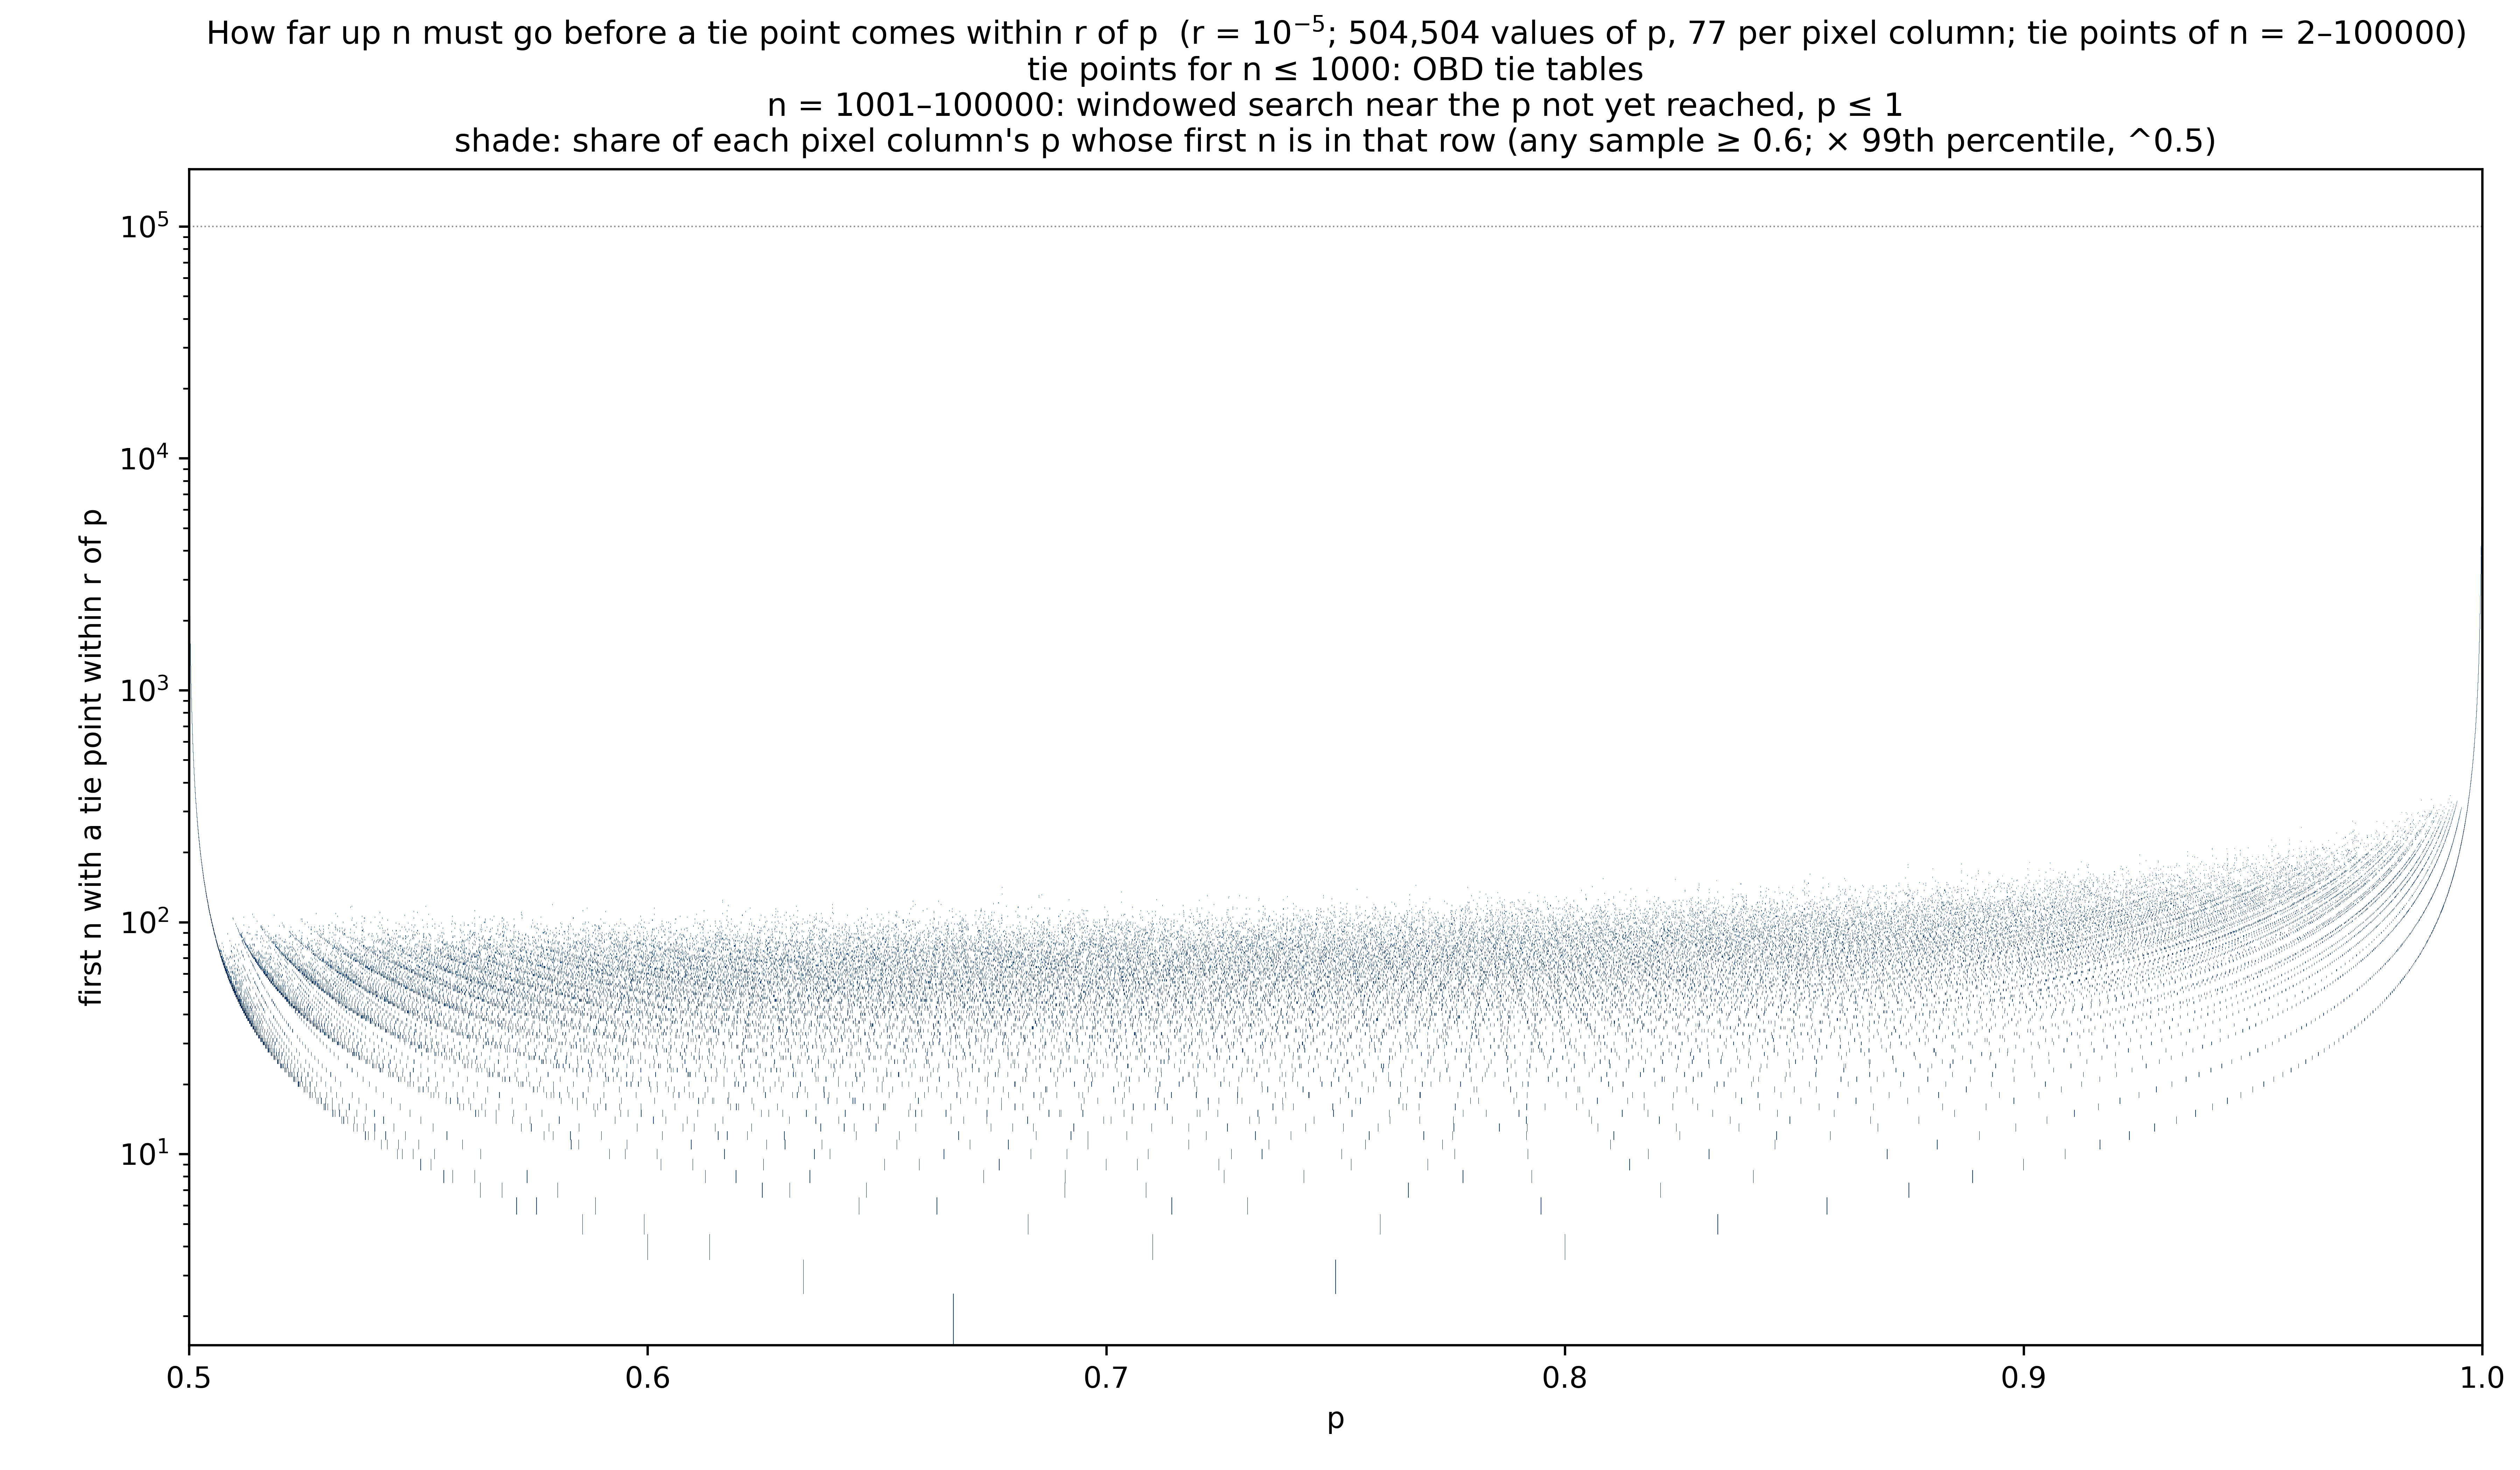
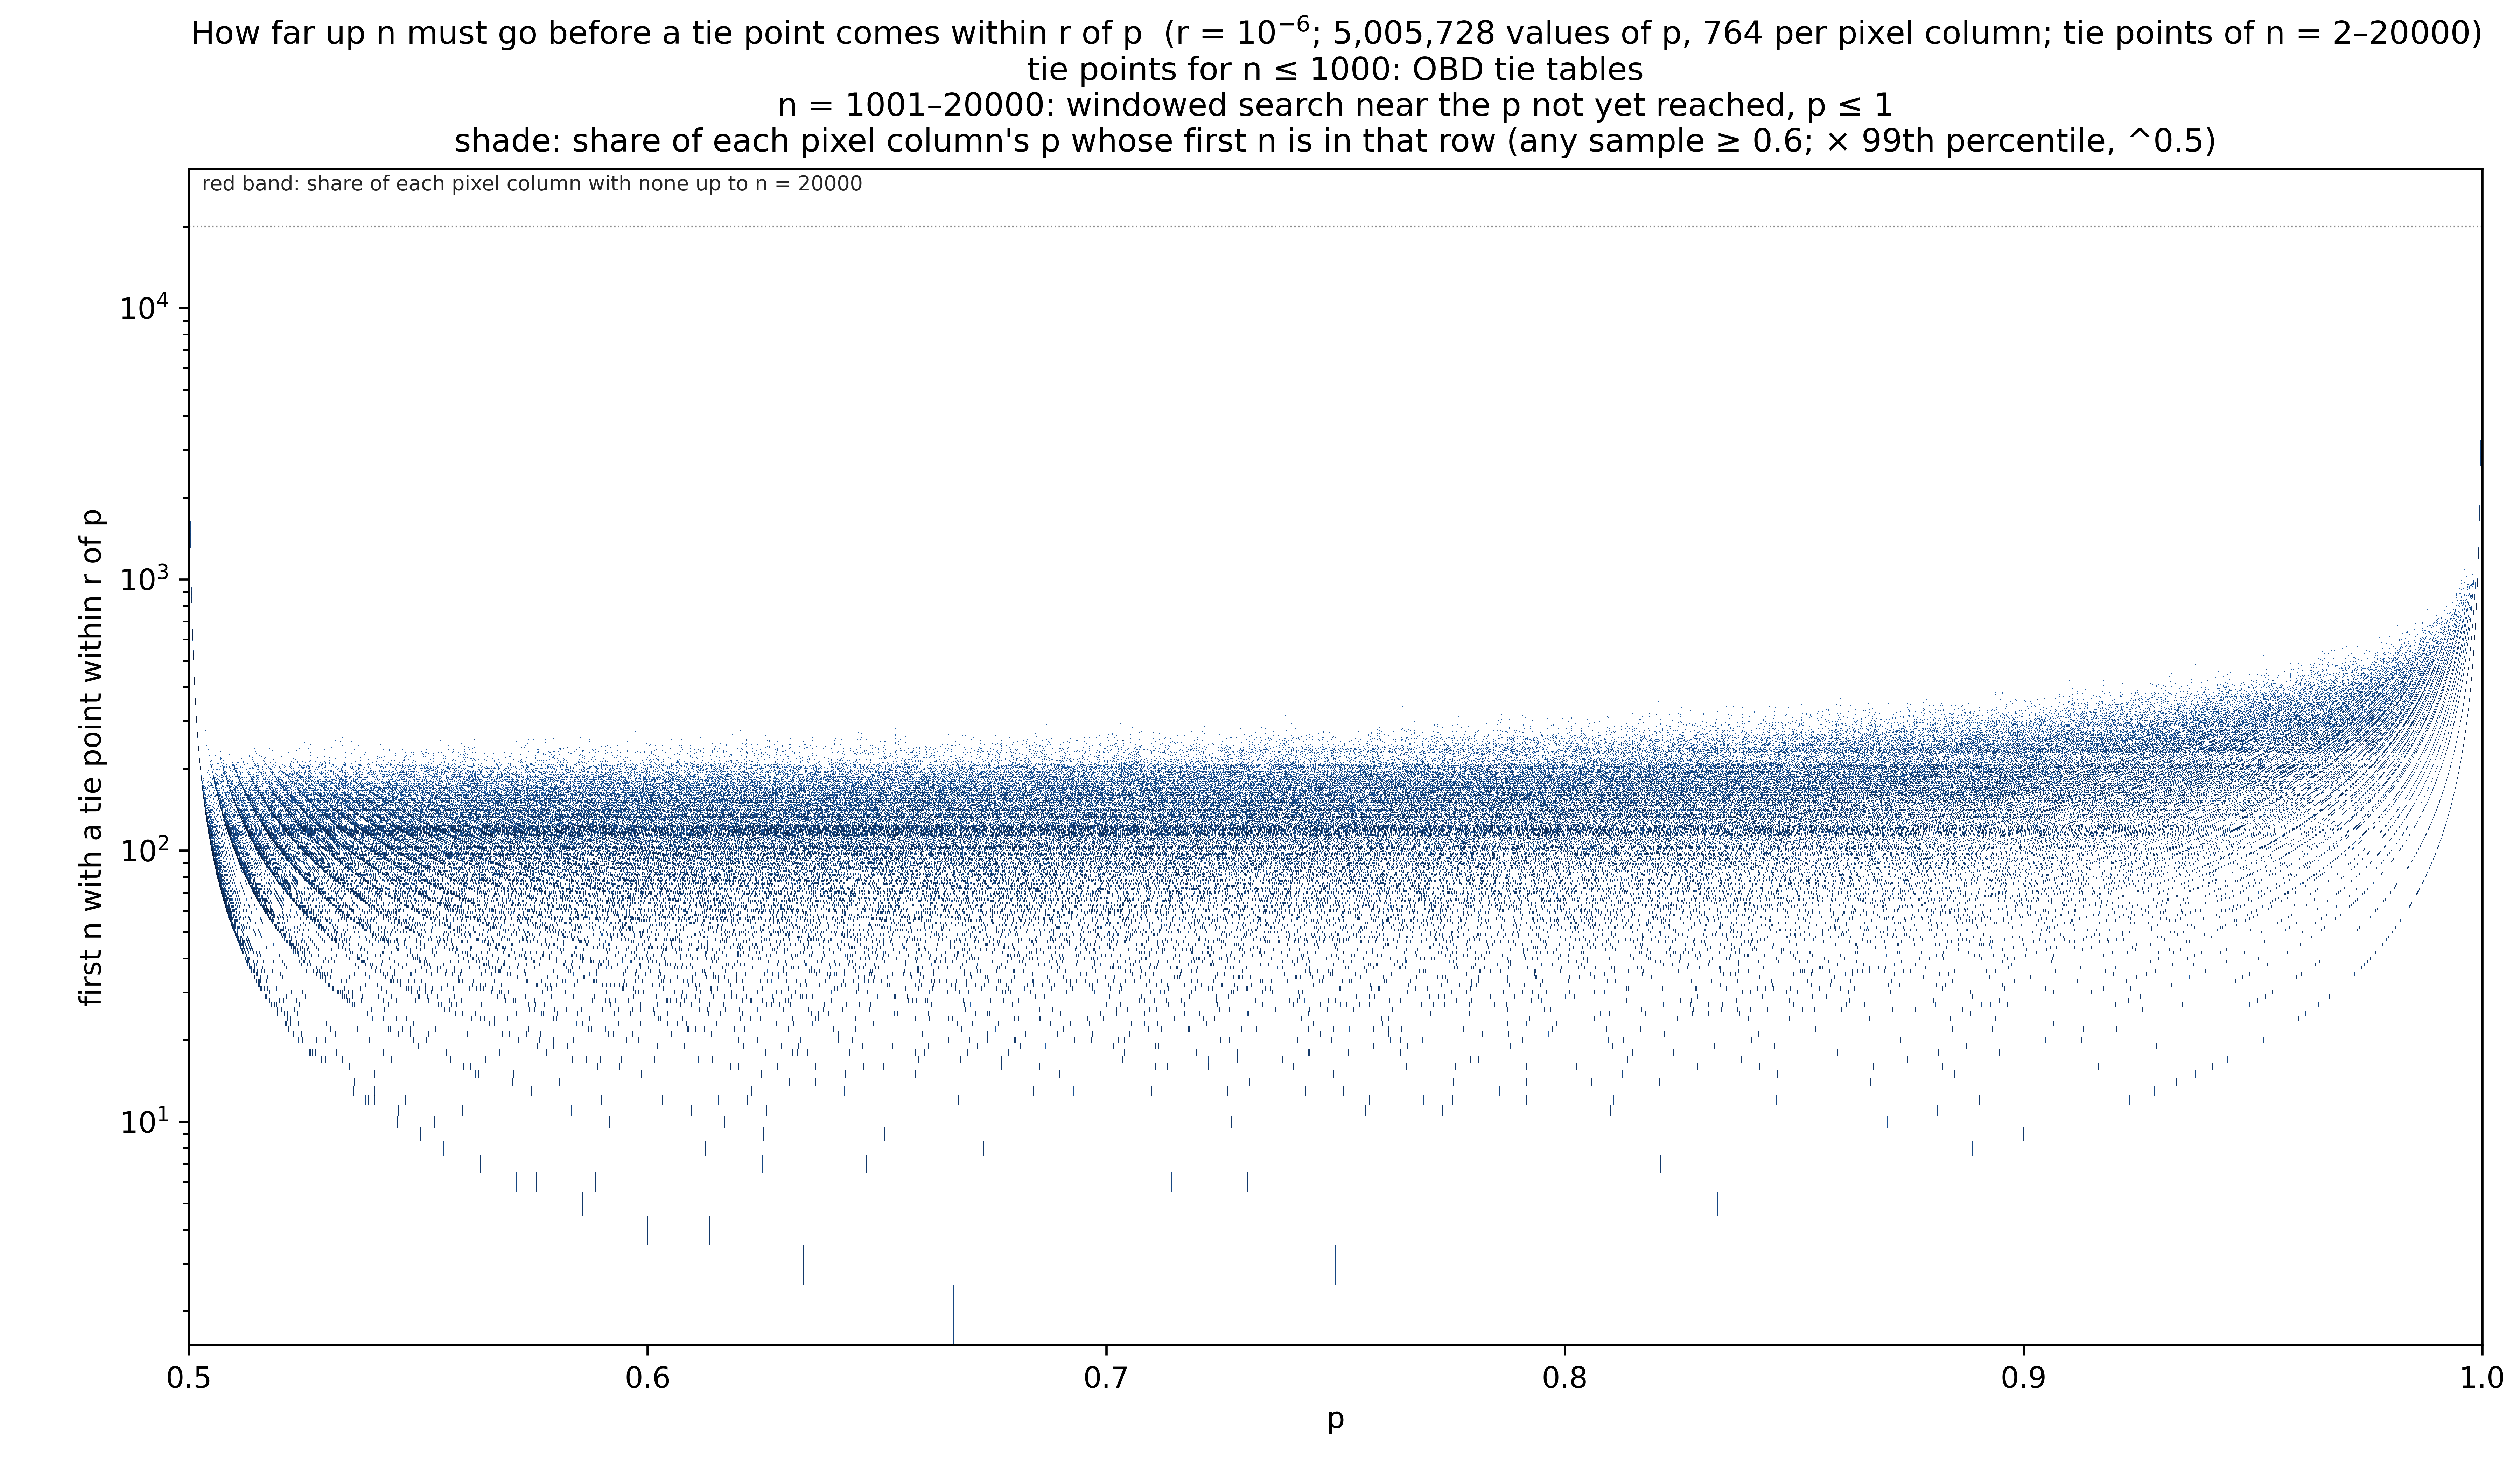
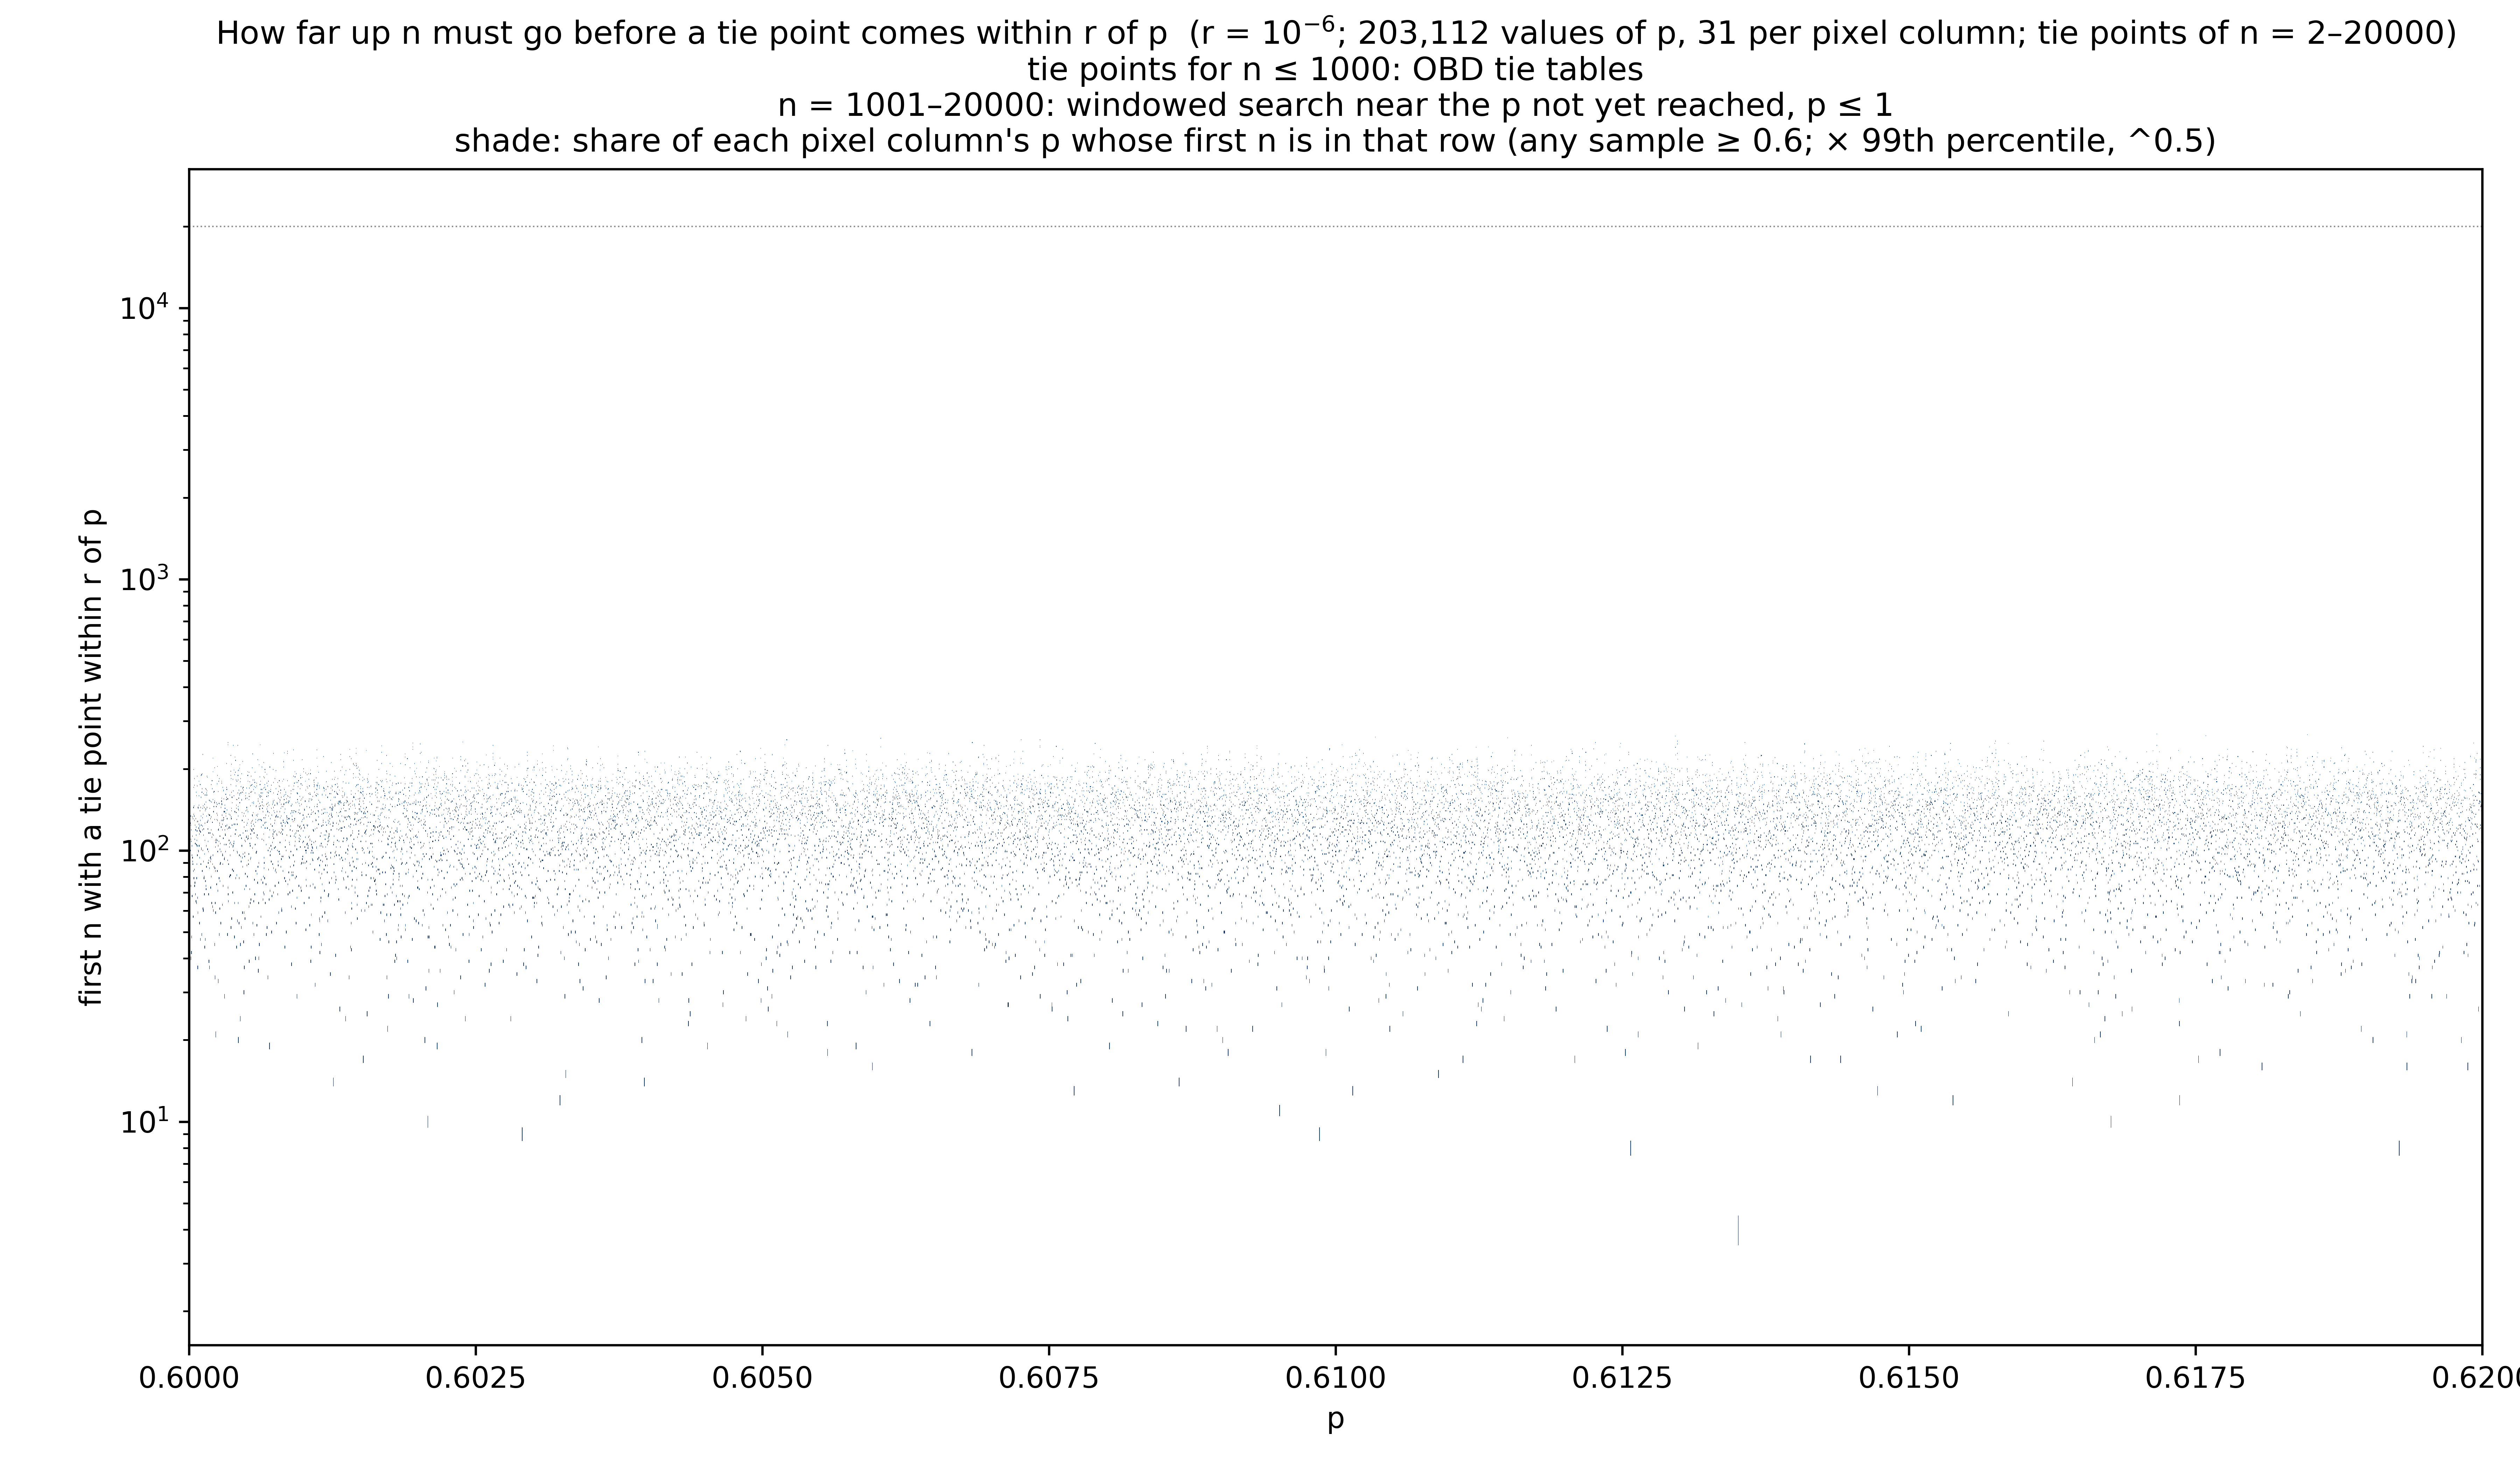
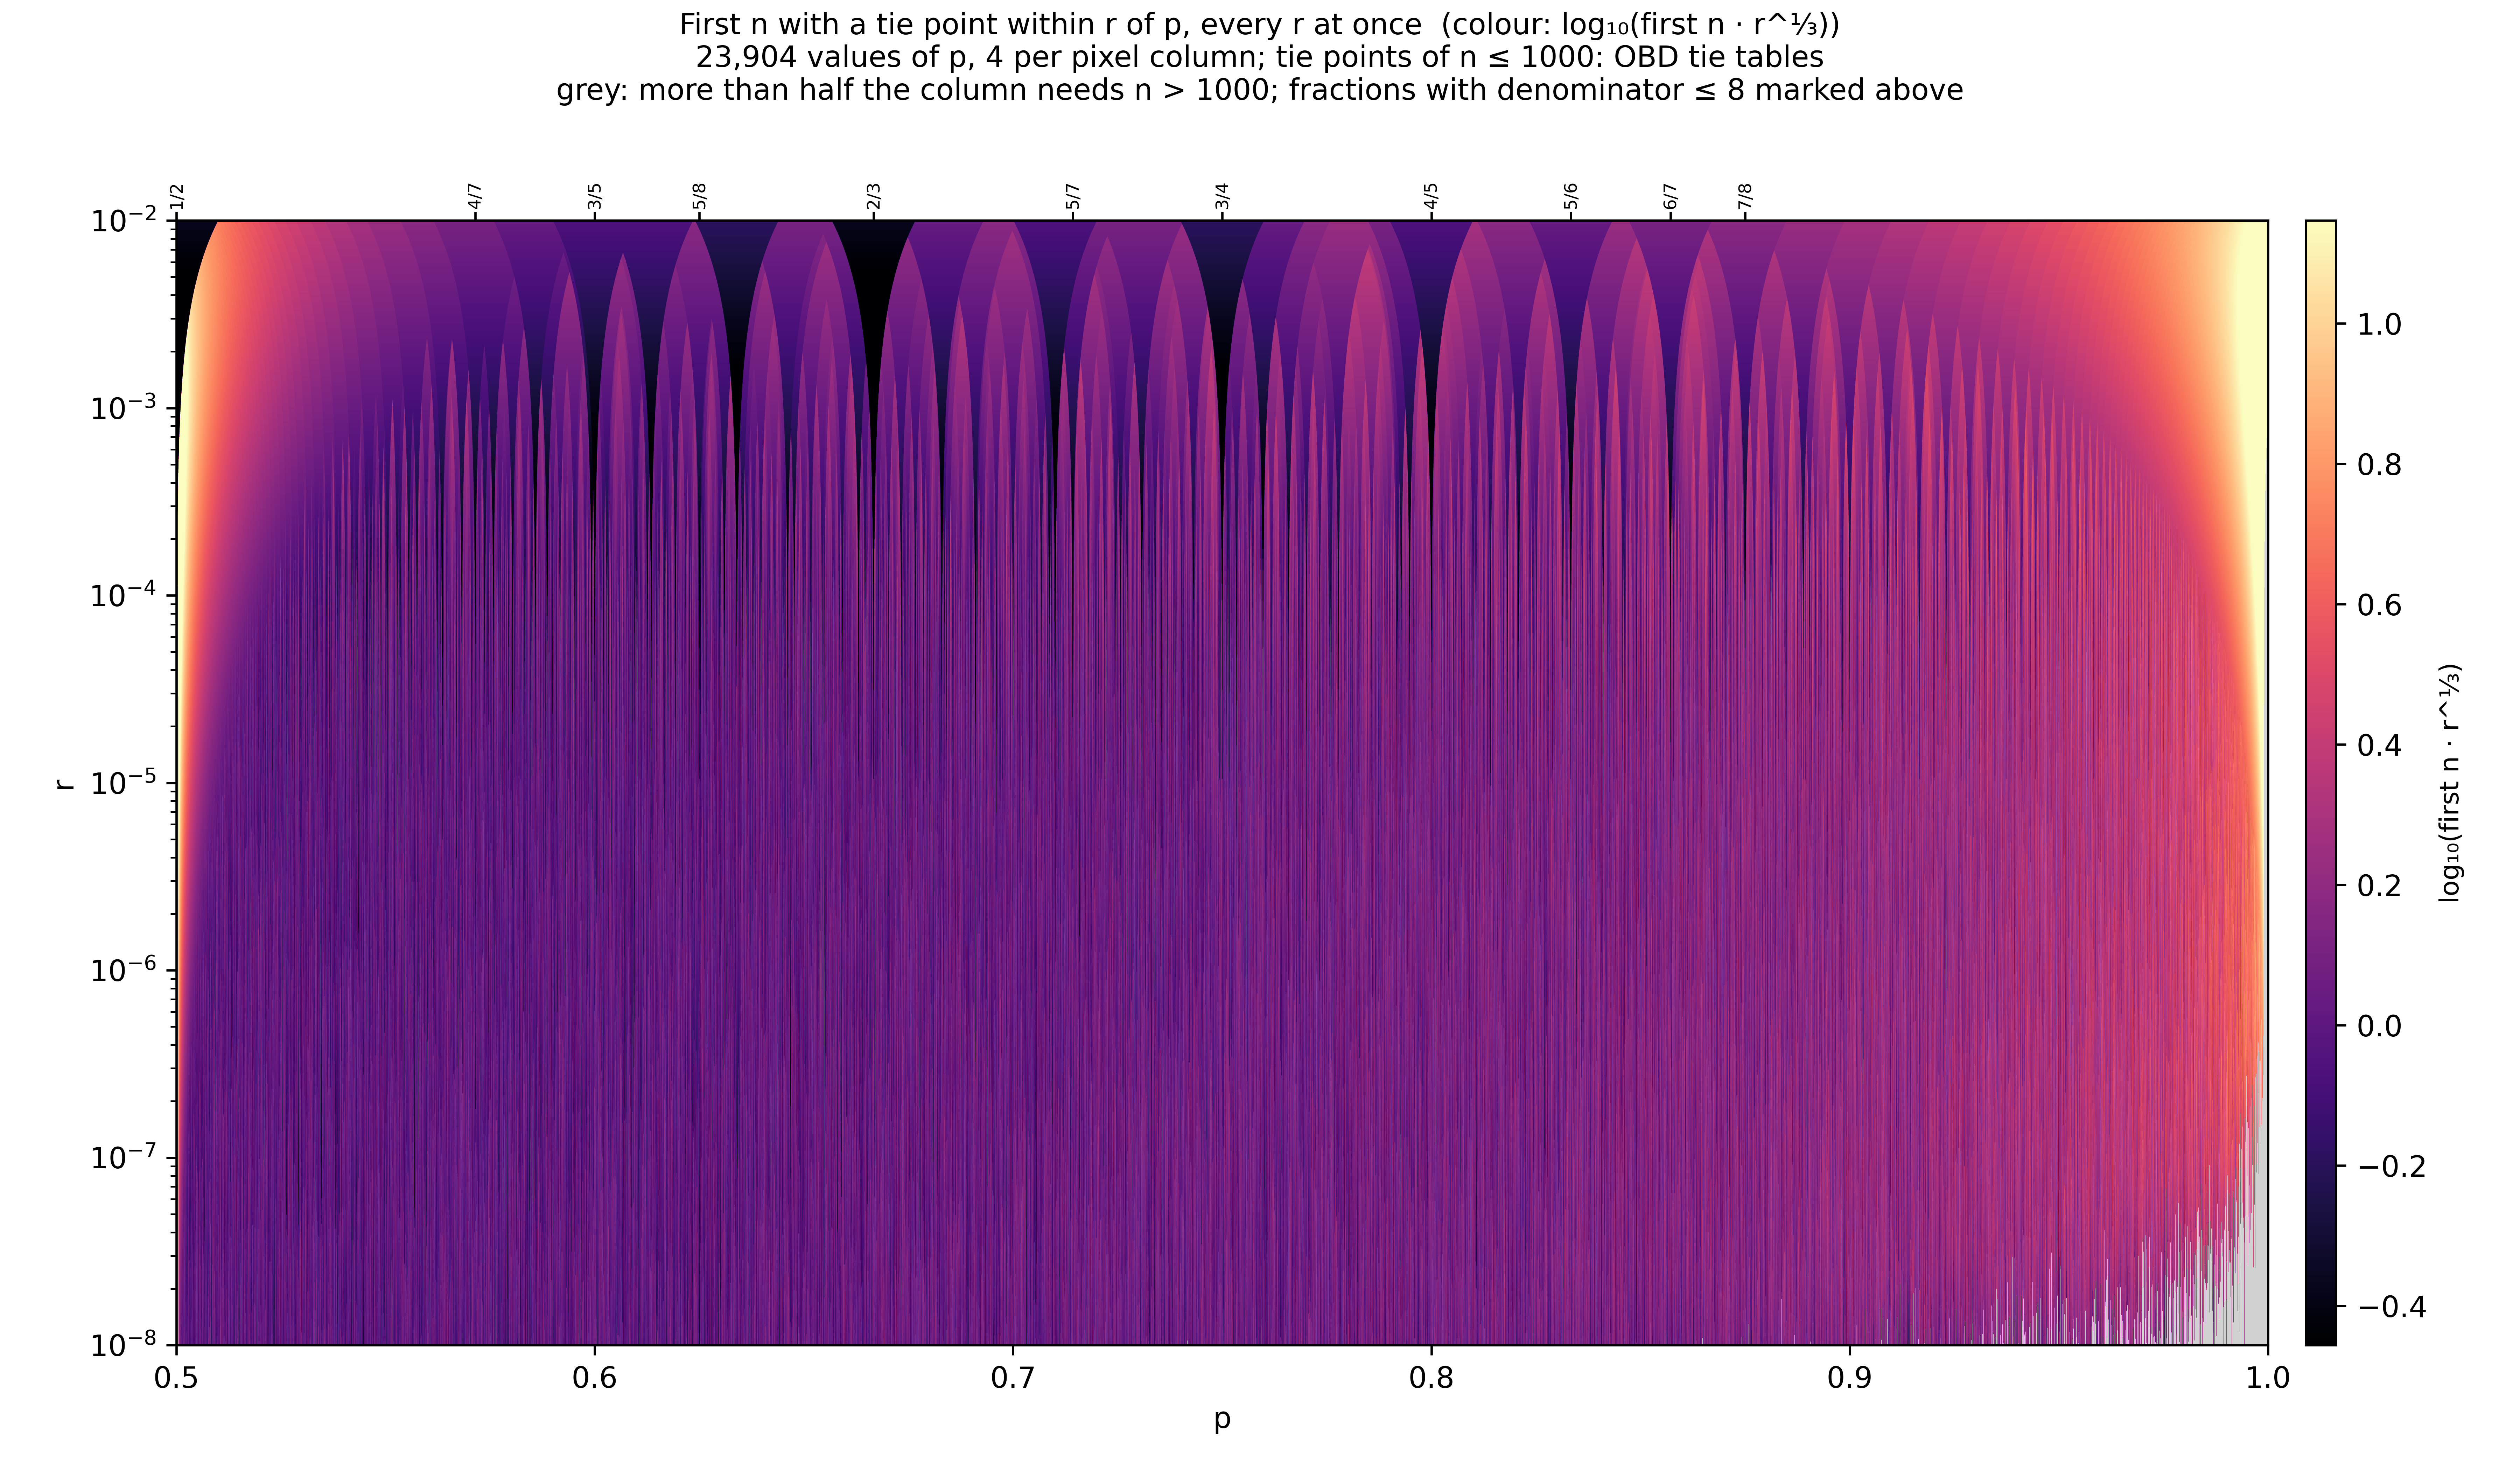
- First n with a tie point (any, not just a cusp) within r of p: r = 0.0001, r = 0.00001, r = 0.000001
- The same as pixel images (crisp at any zoom): tie points r = 0.00001, r = 0.000001, r = 0.000001, 0.60 ≤ p ≤ 0.62; cusps r = 0.000001, r = 0.000001, 0.60 ≤ p ≤ 0.62
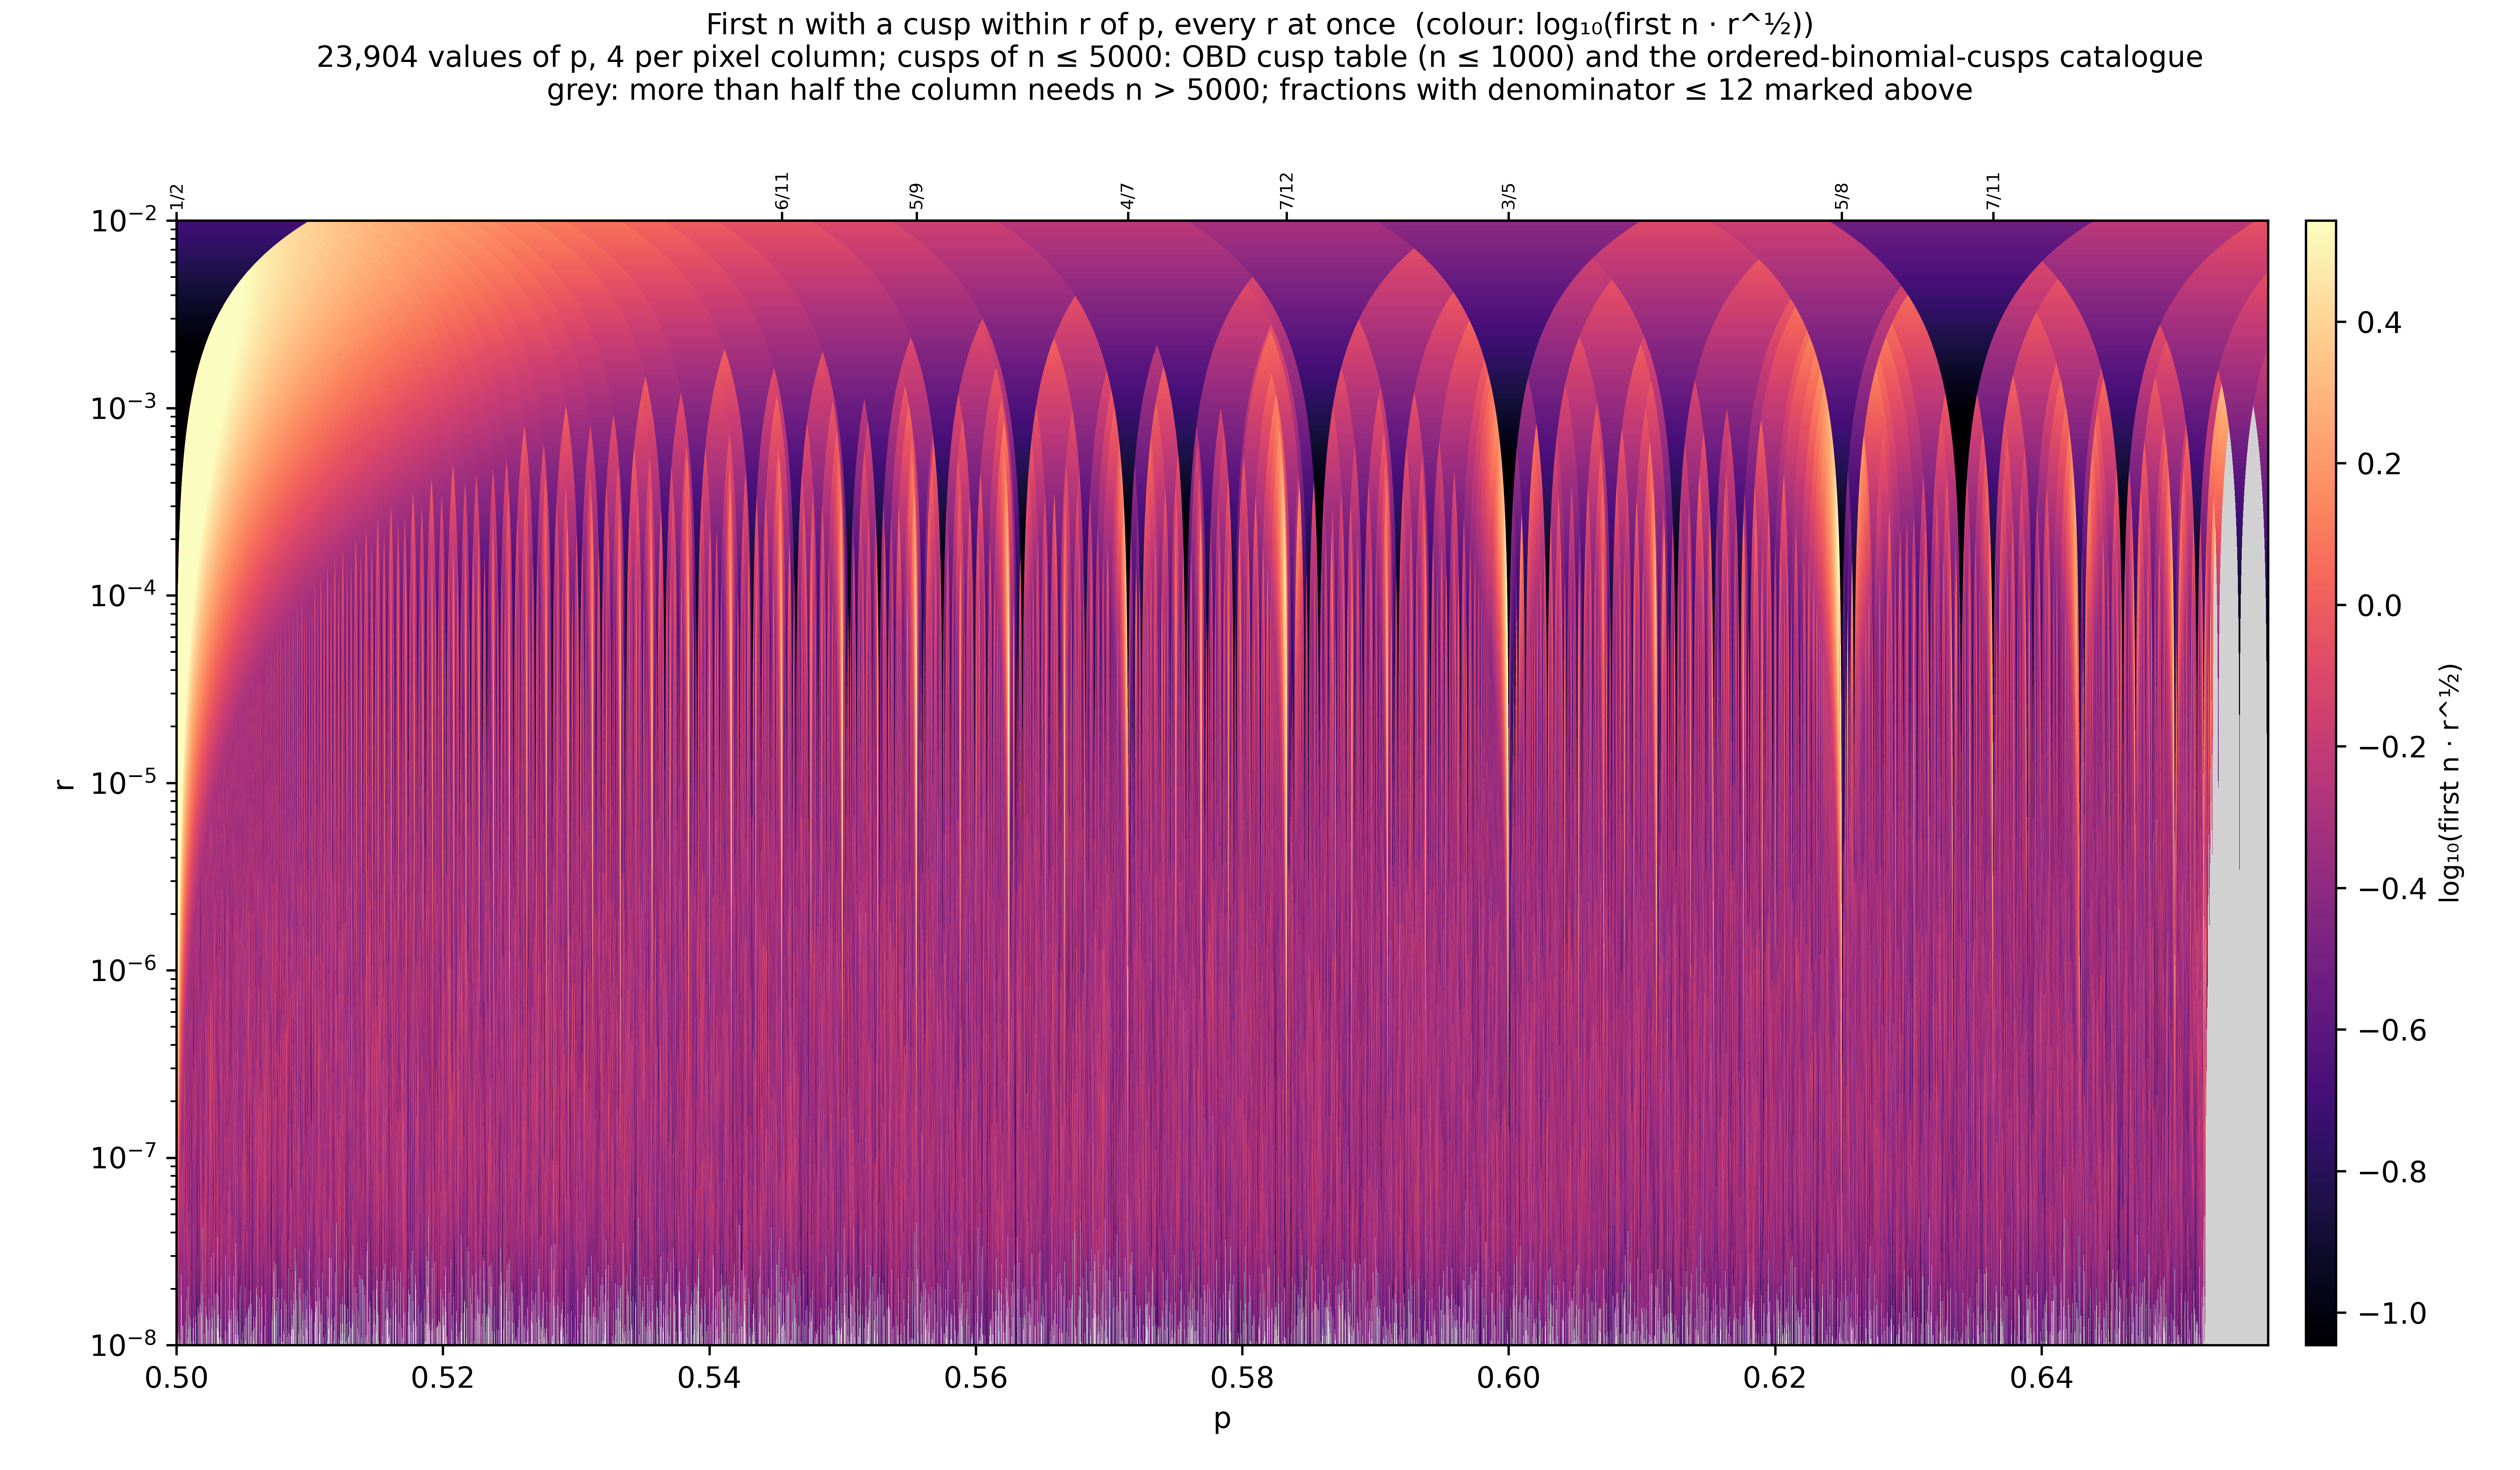
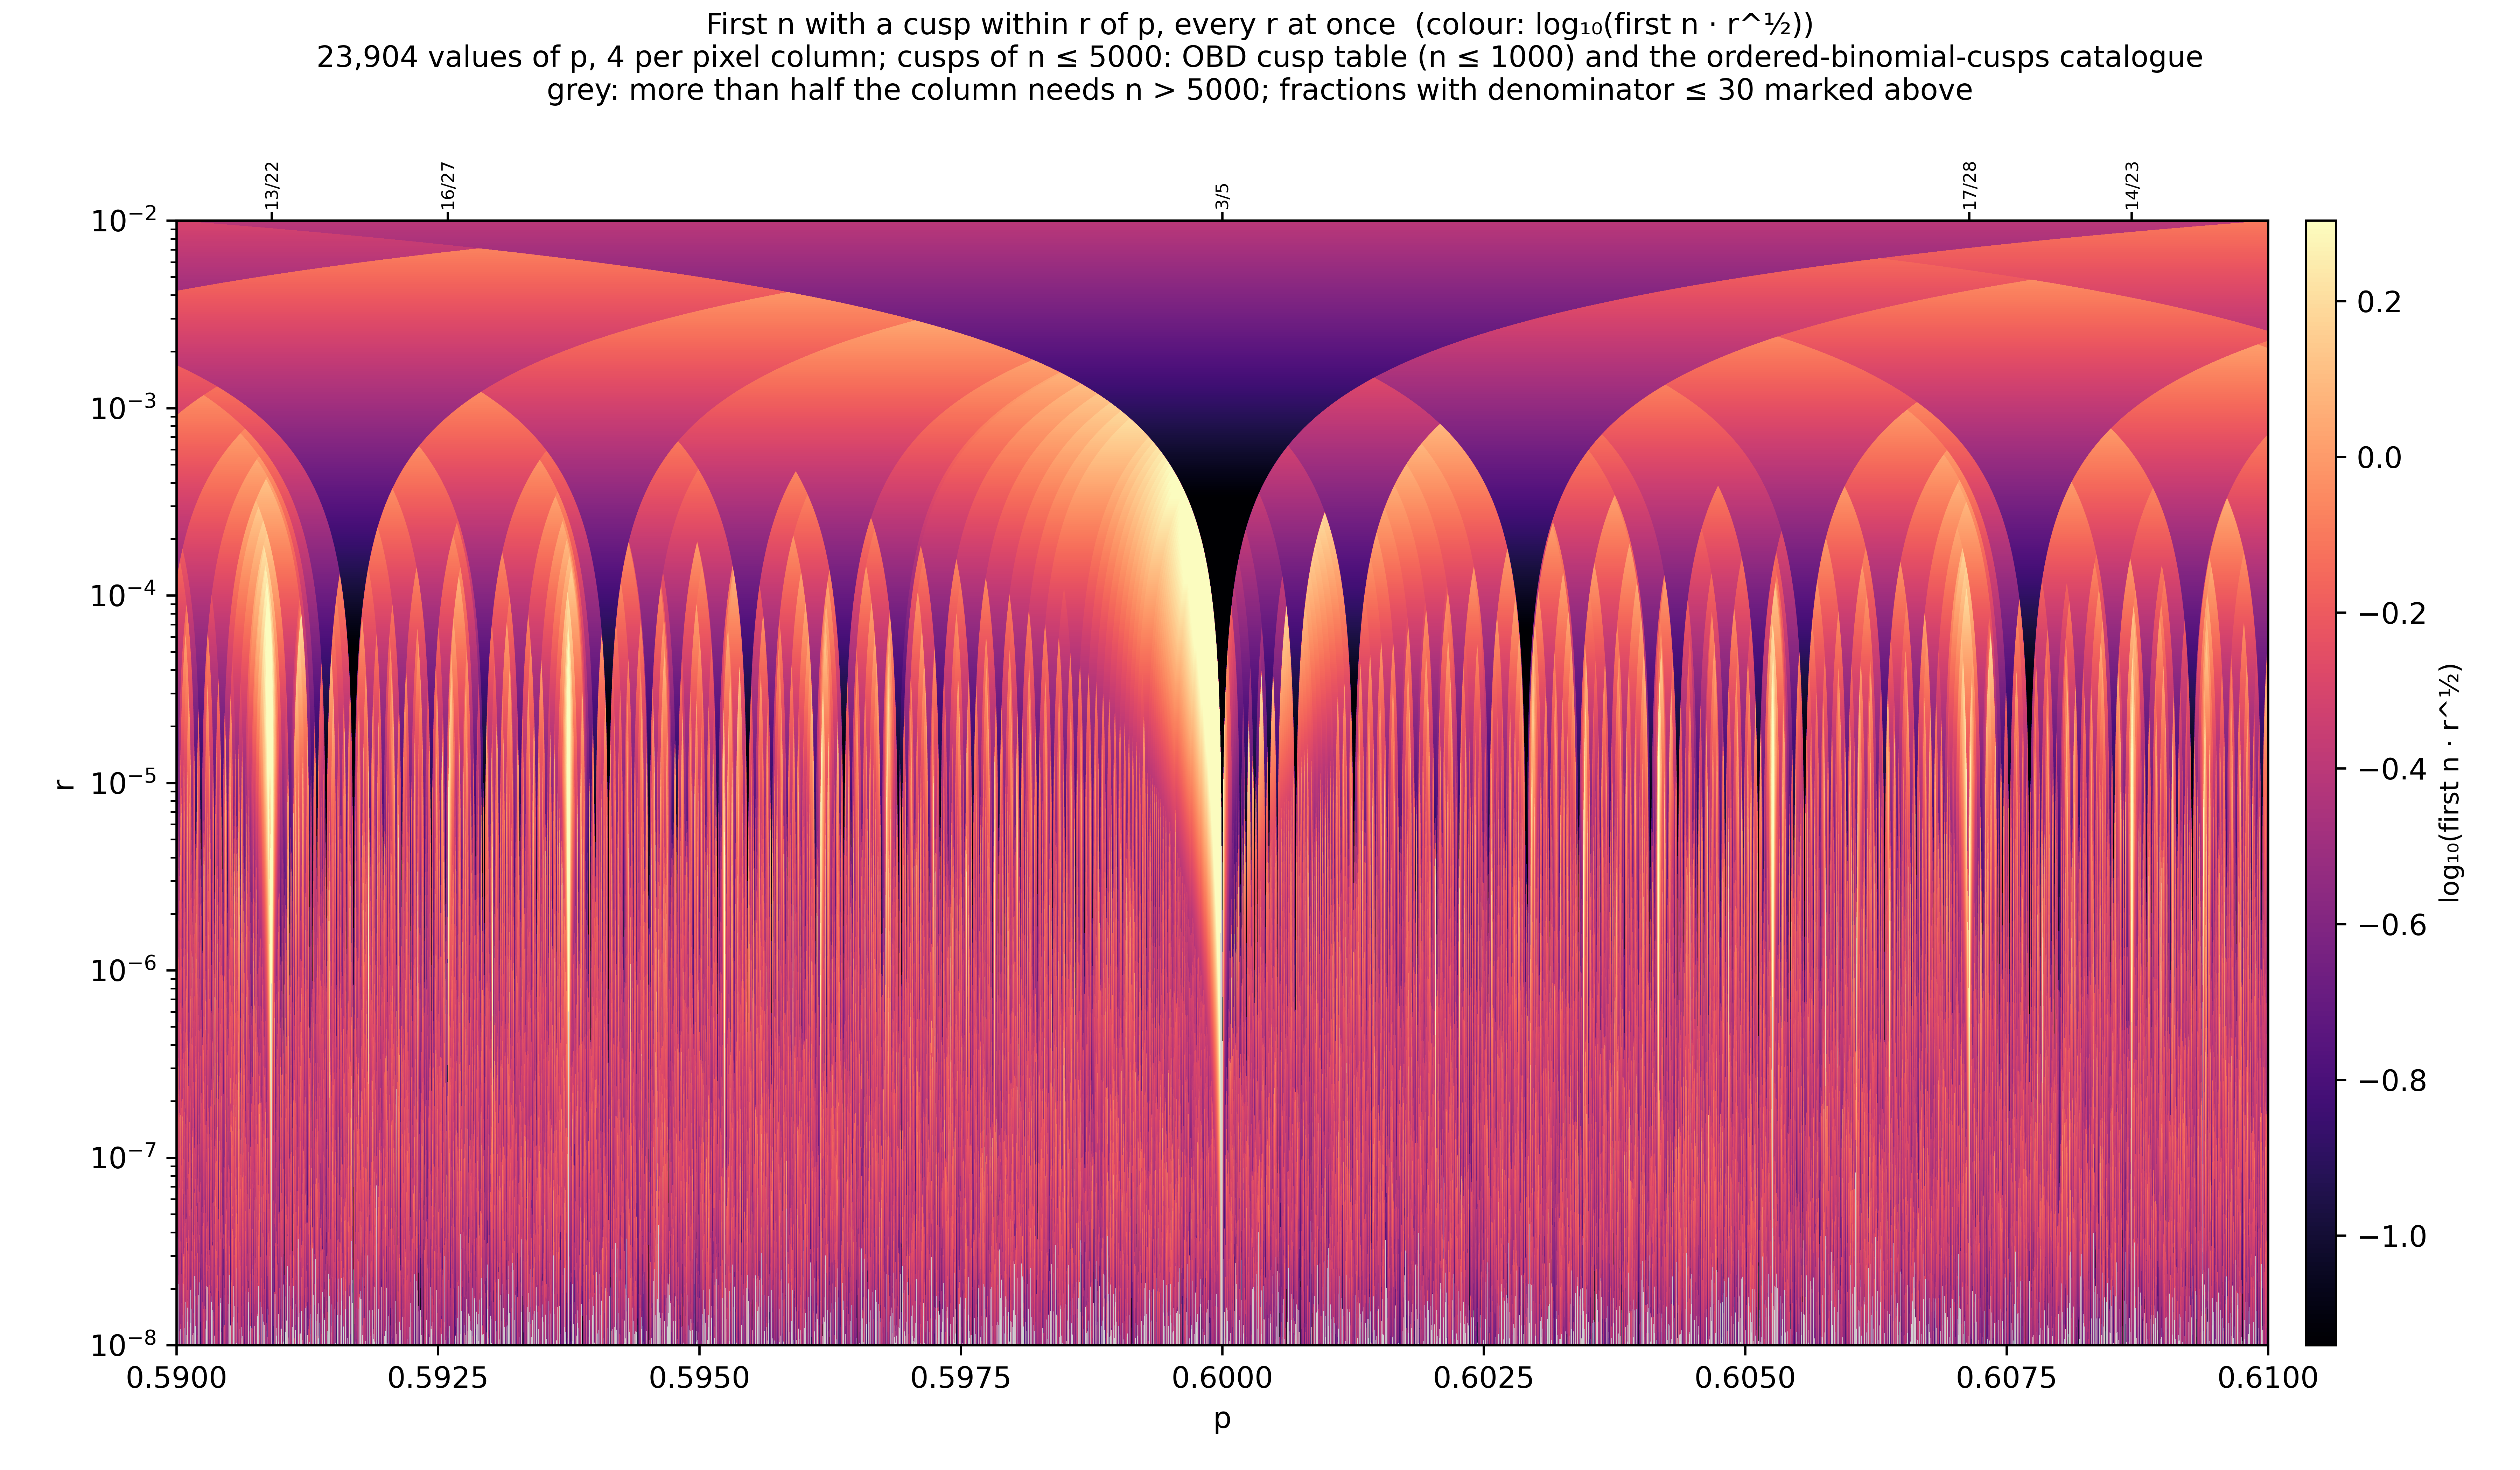
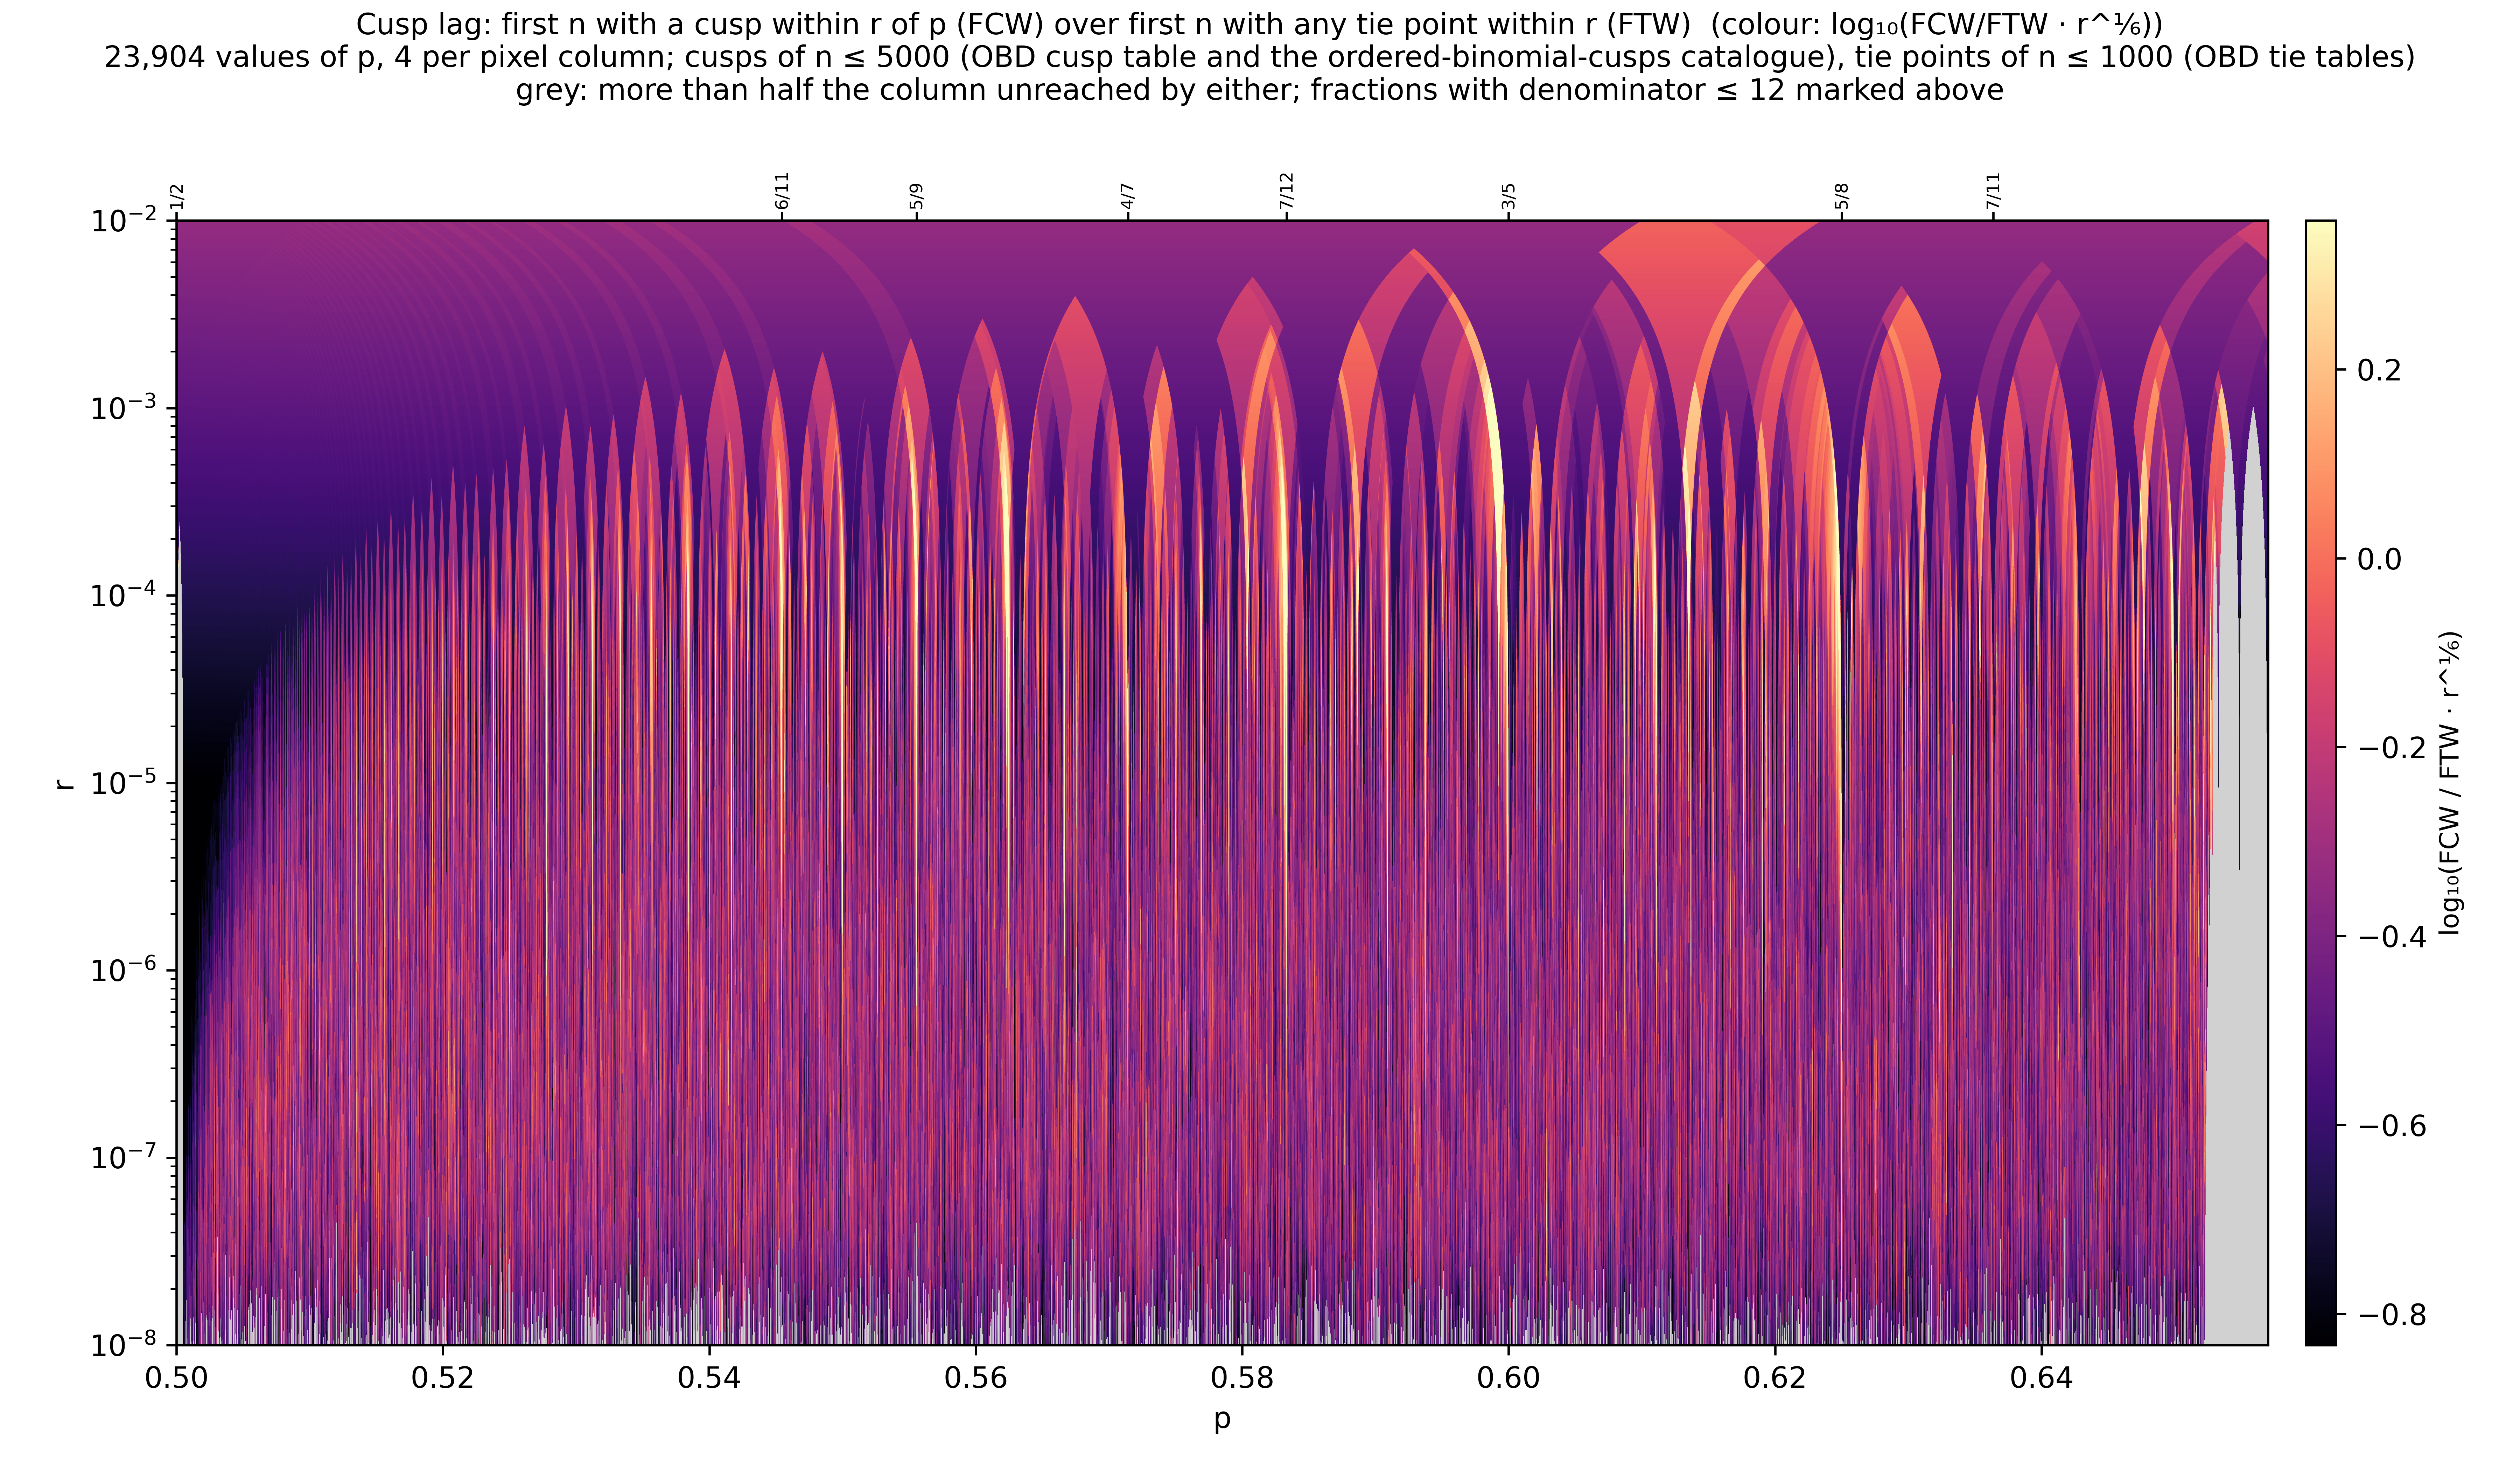
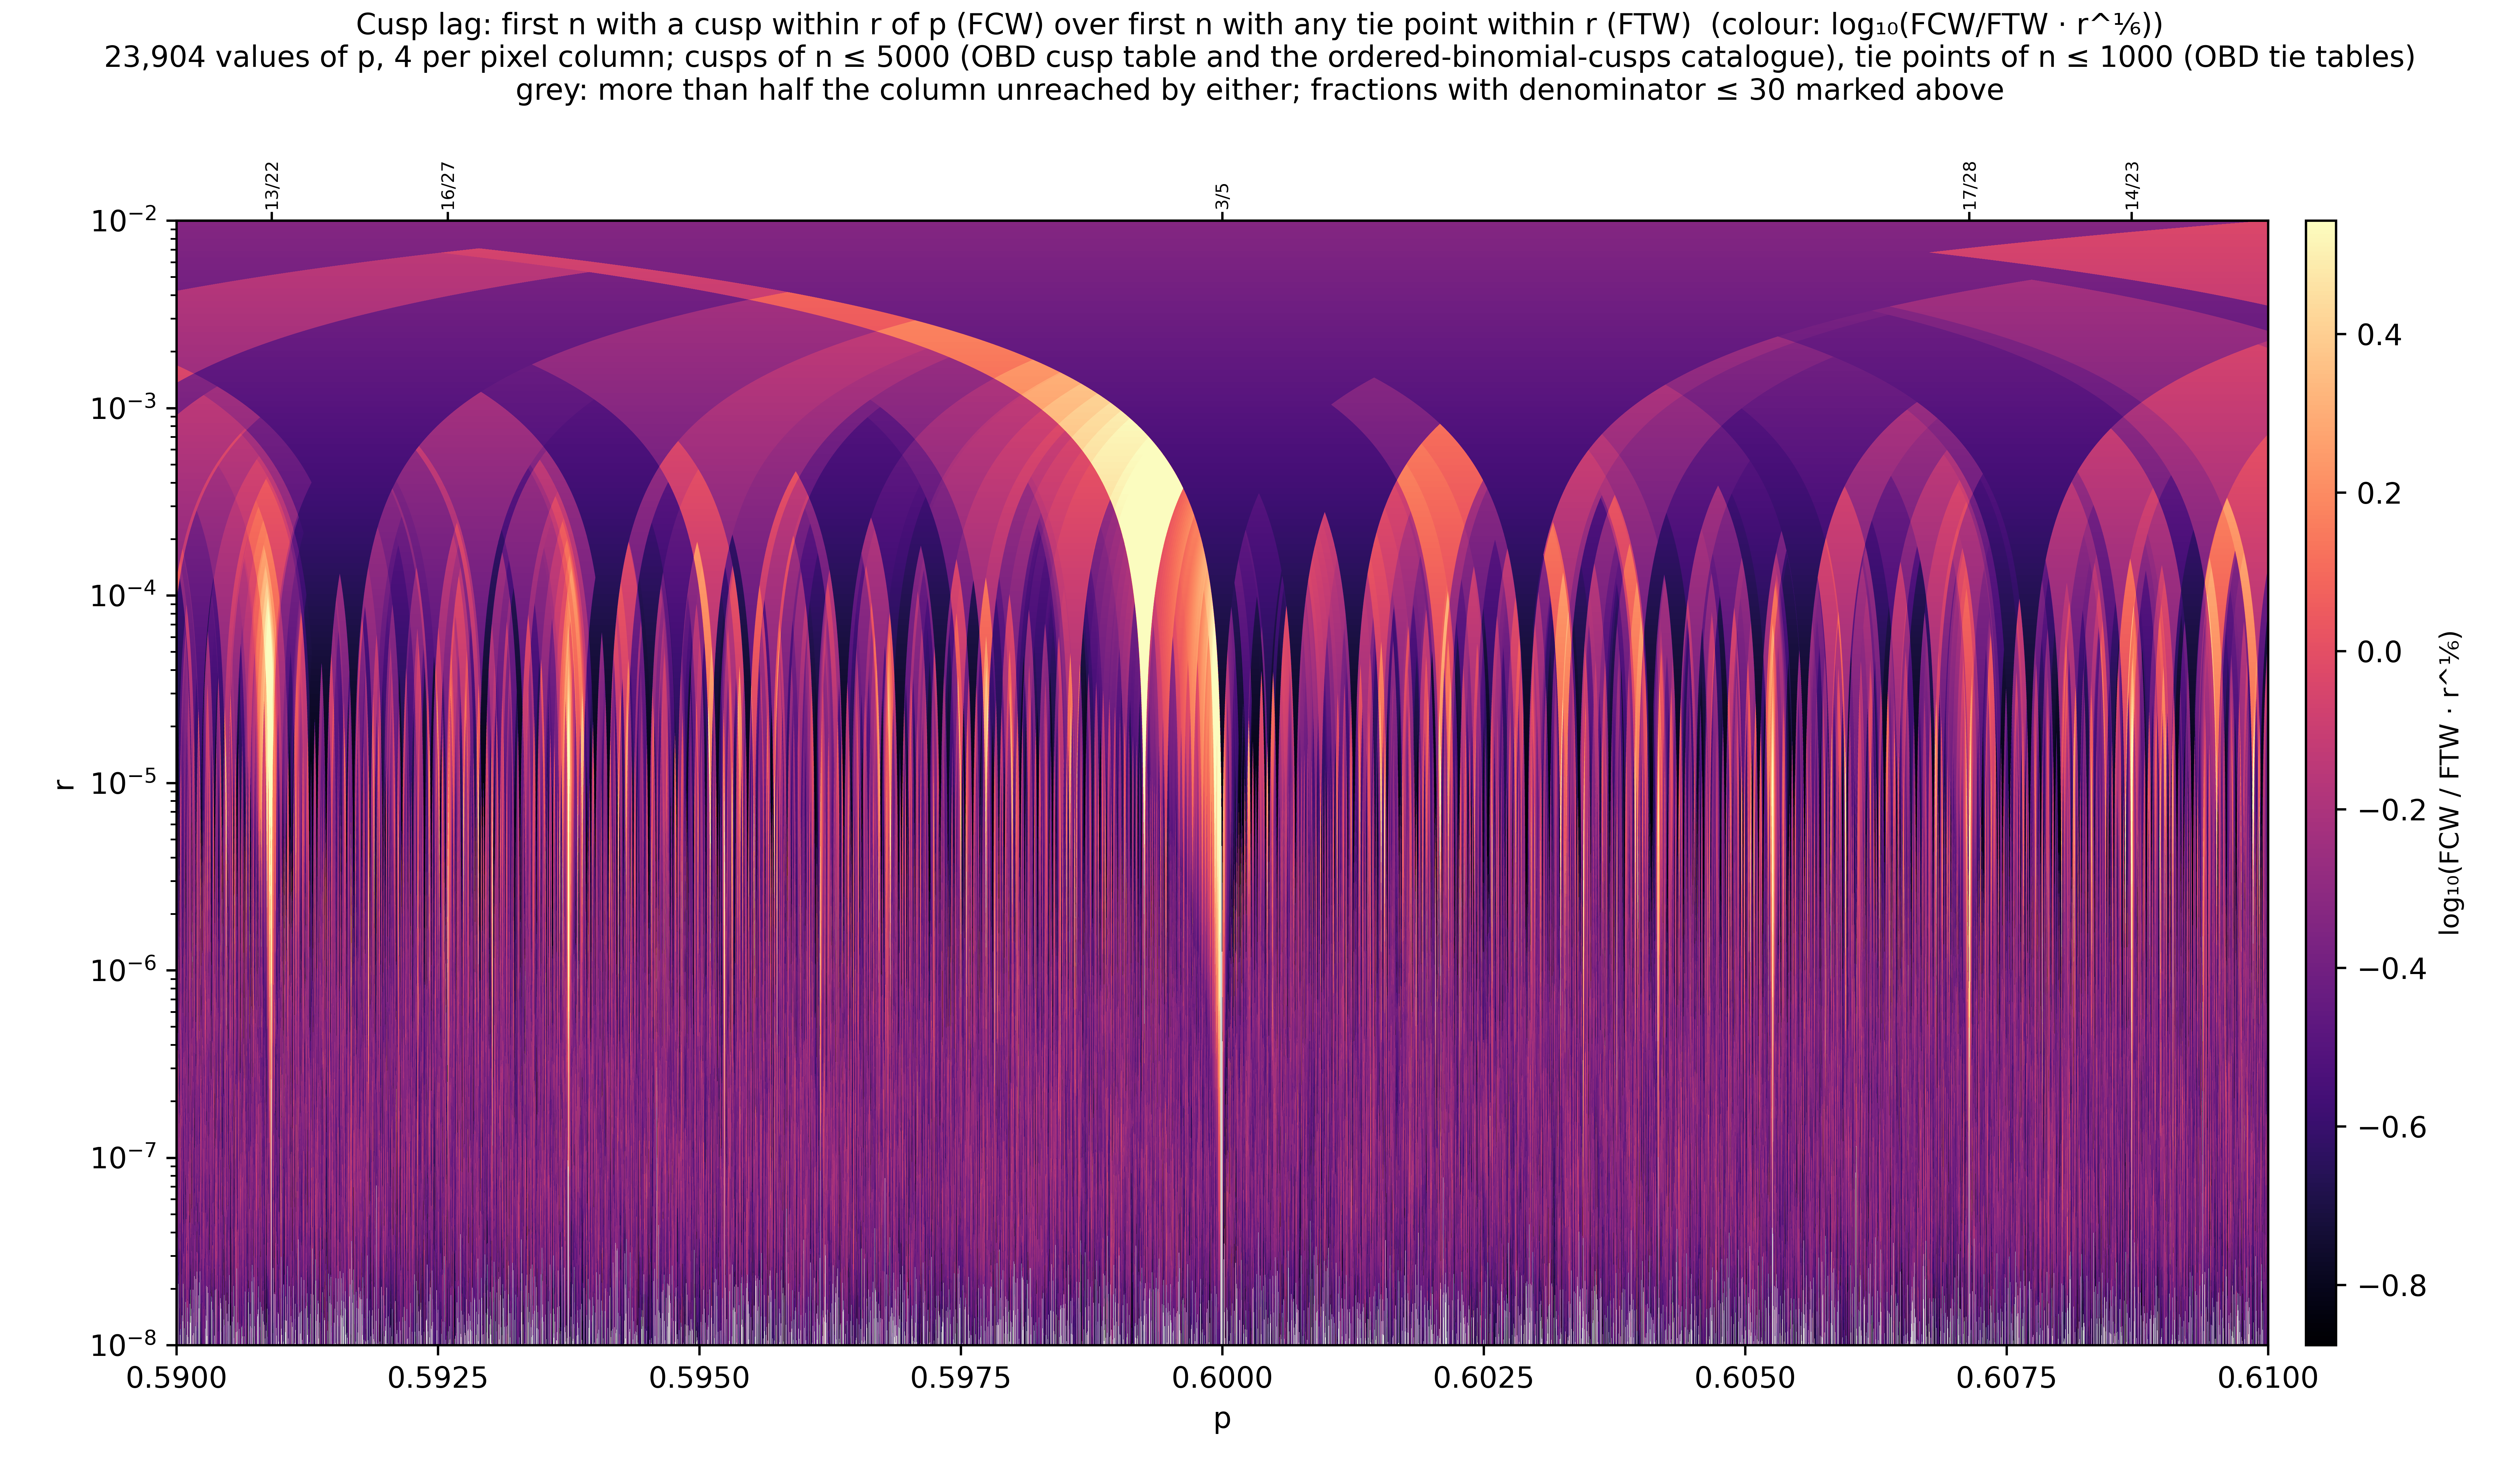
- Every r at once, as a (p, r) map: cusps, tie points, cusps, 0.59 ≤ p ≤ 0.61 (the 3/5 tongue); the cusp lag, cusps over tie points: full band, 0.59 ≤ p ≤ 0.61
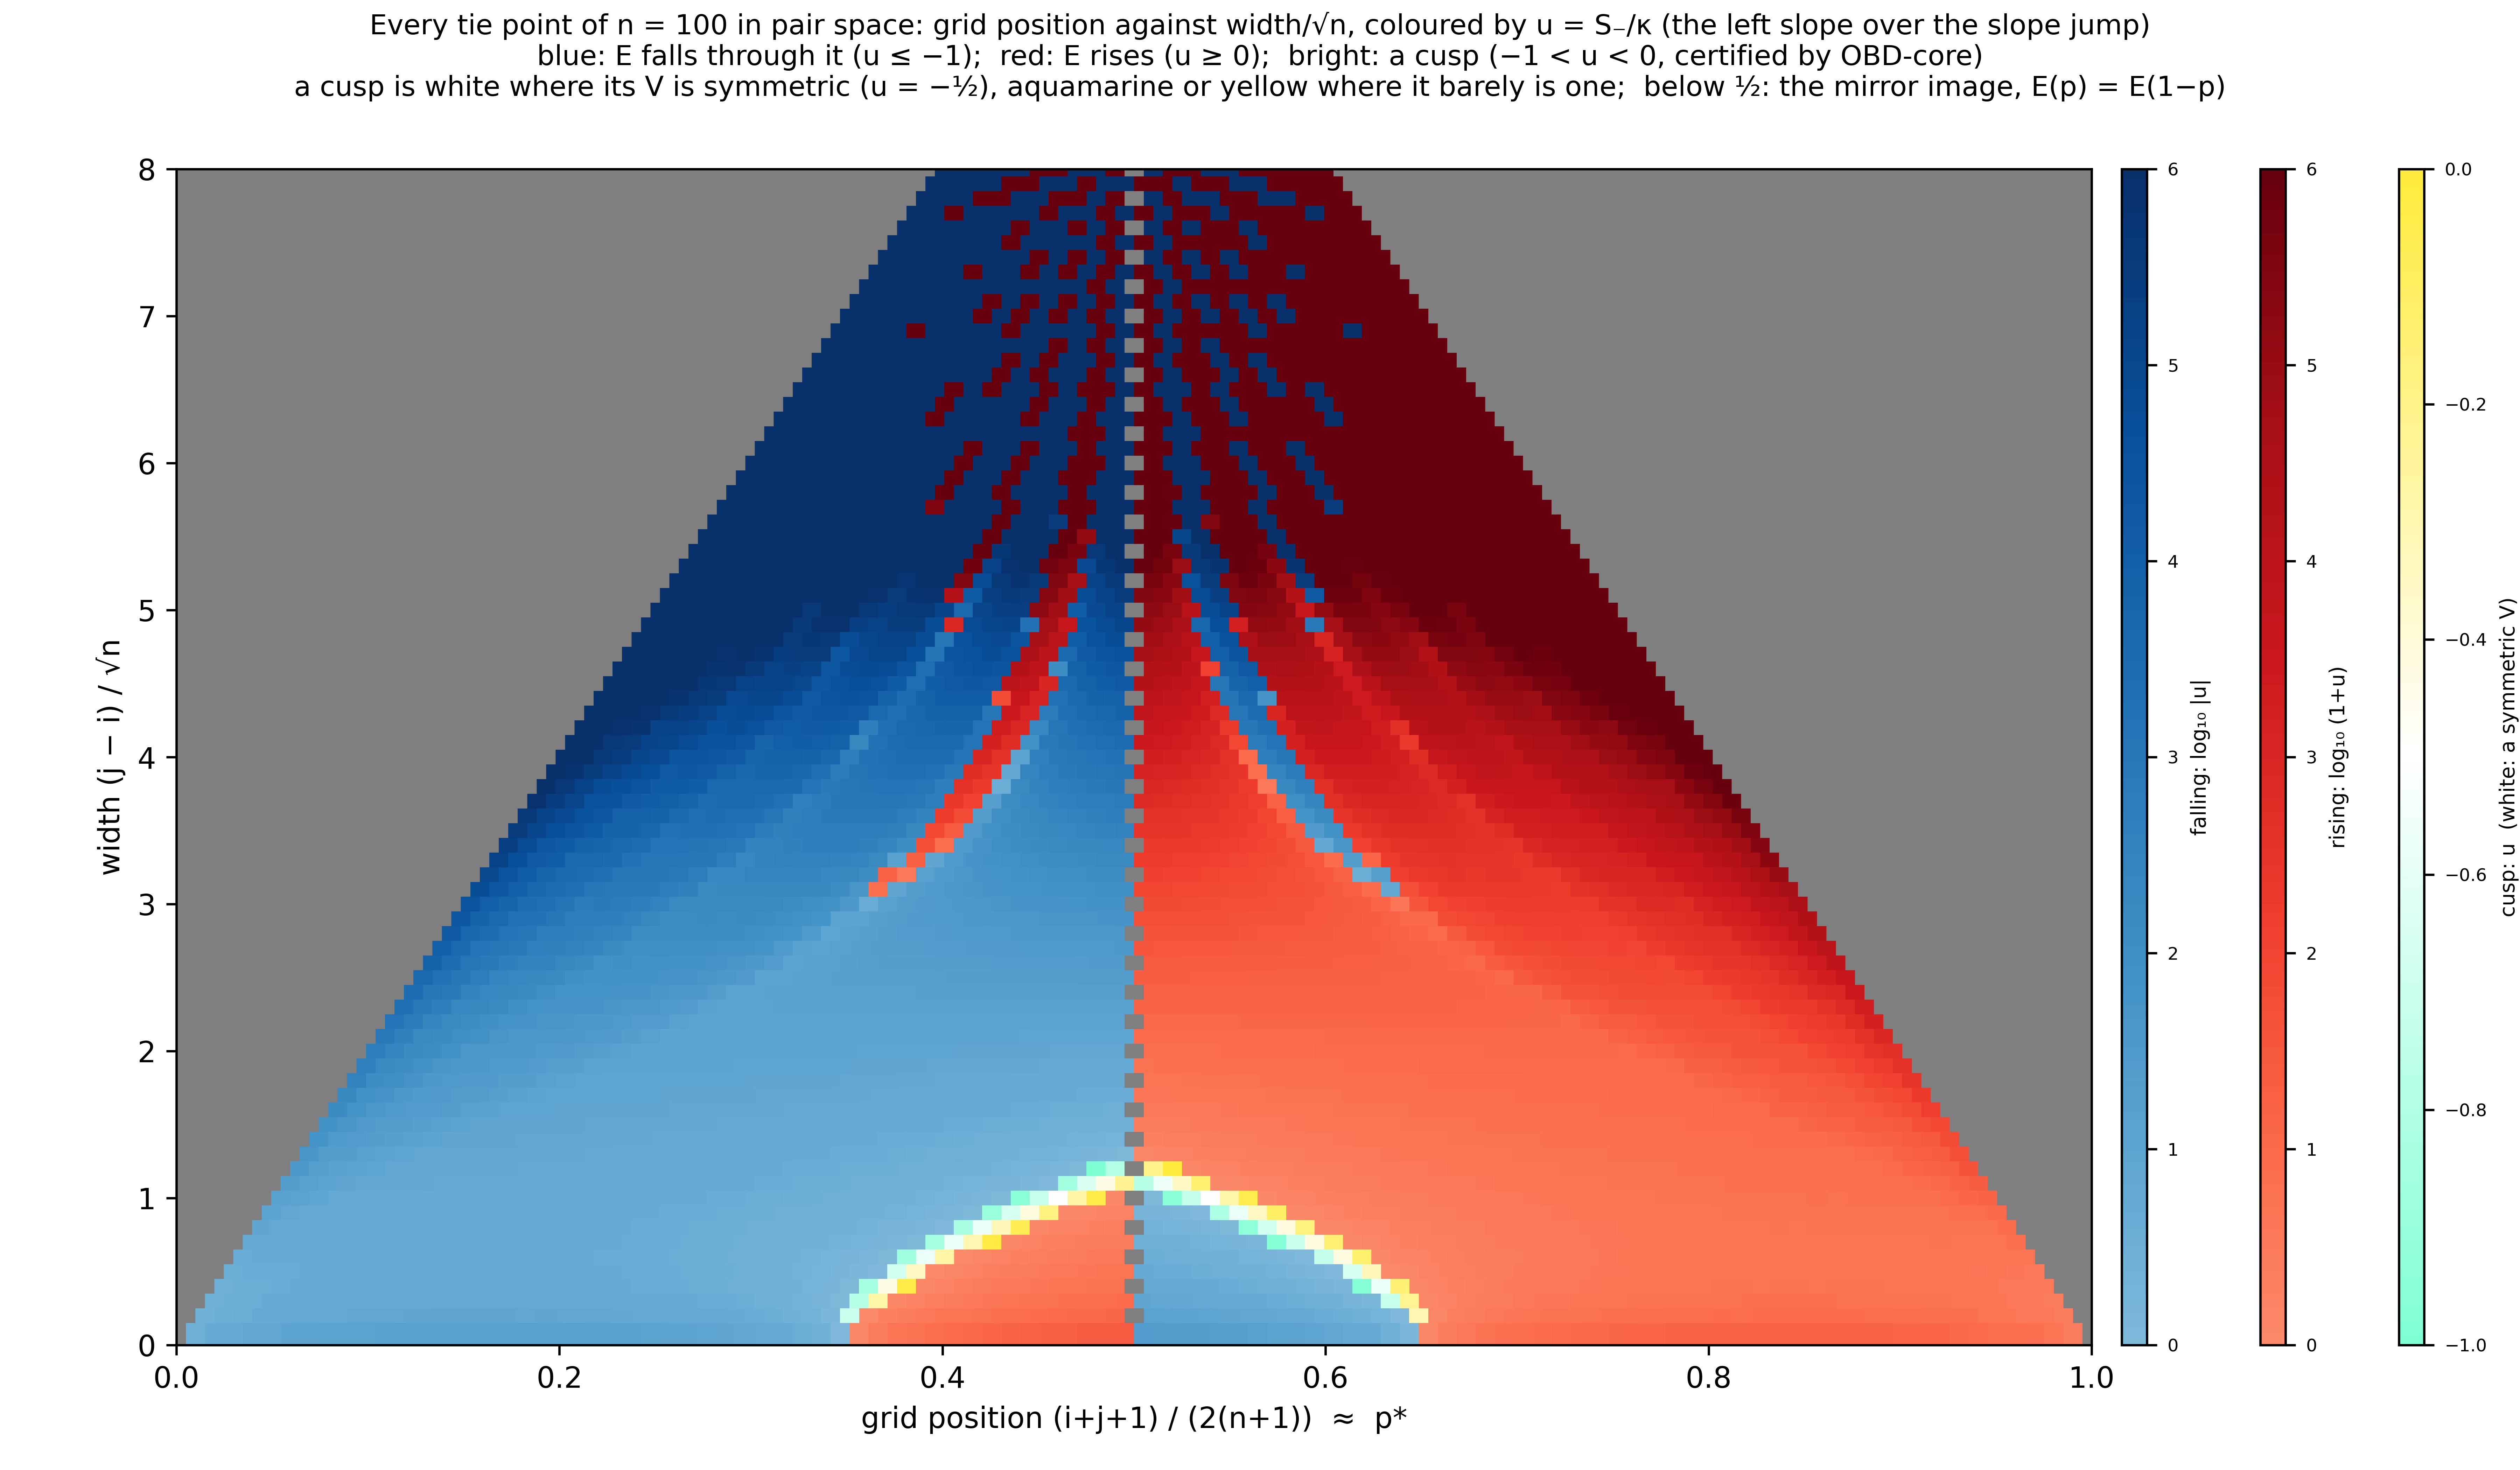
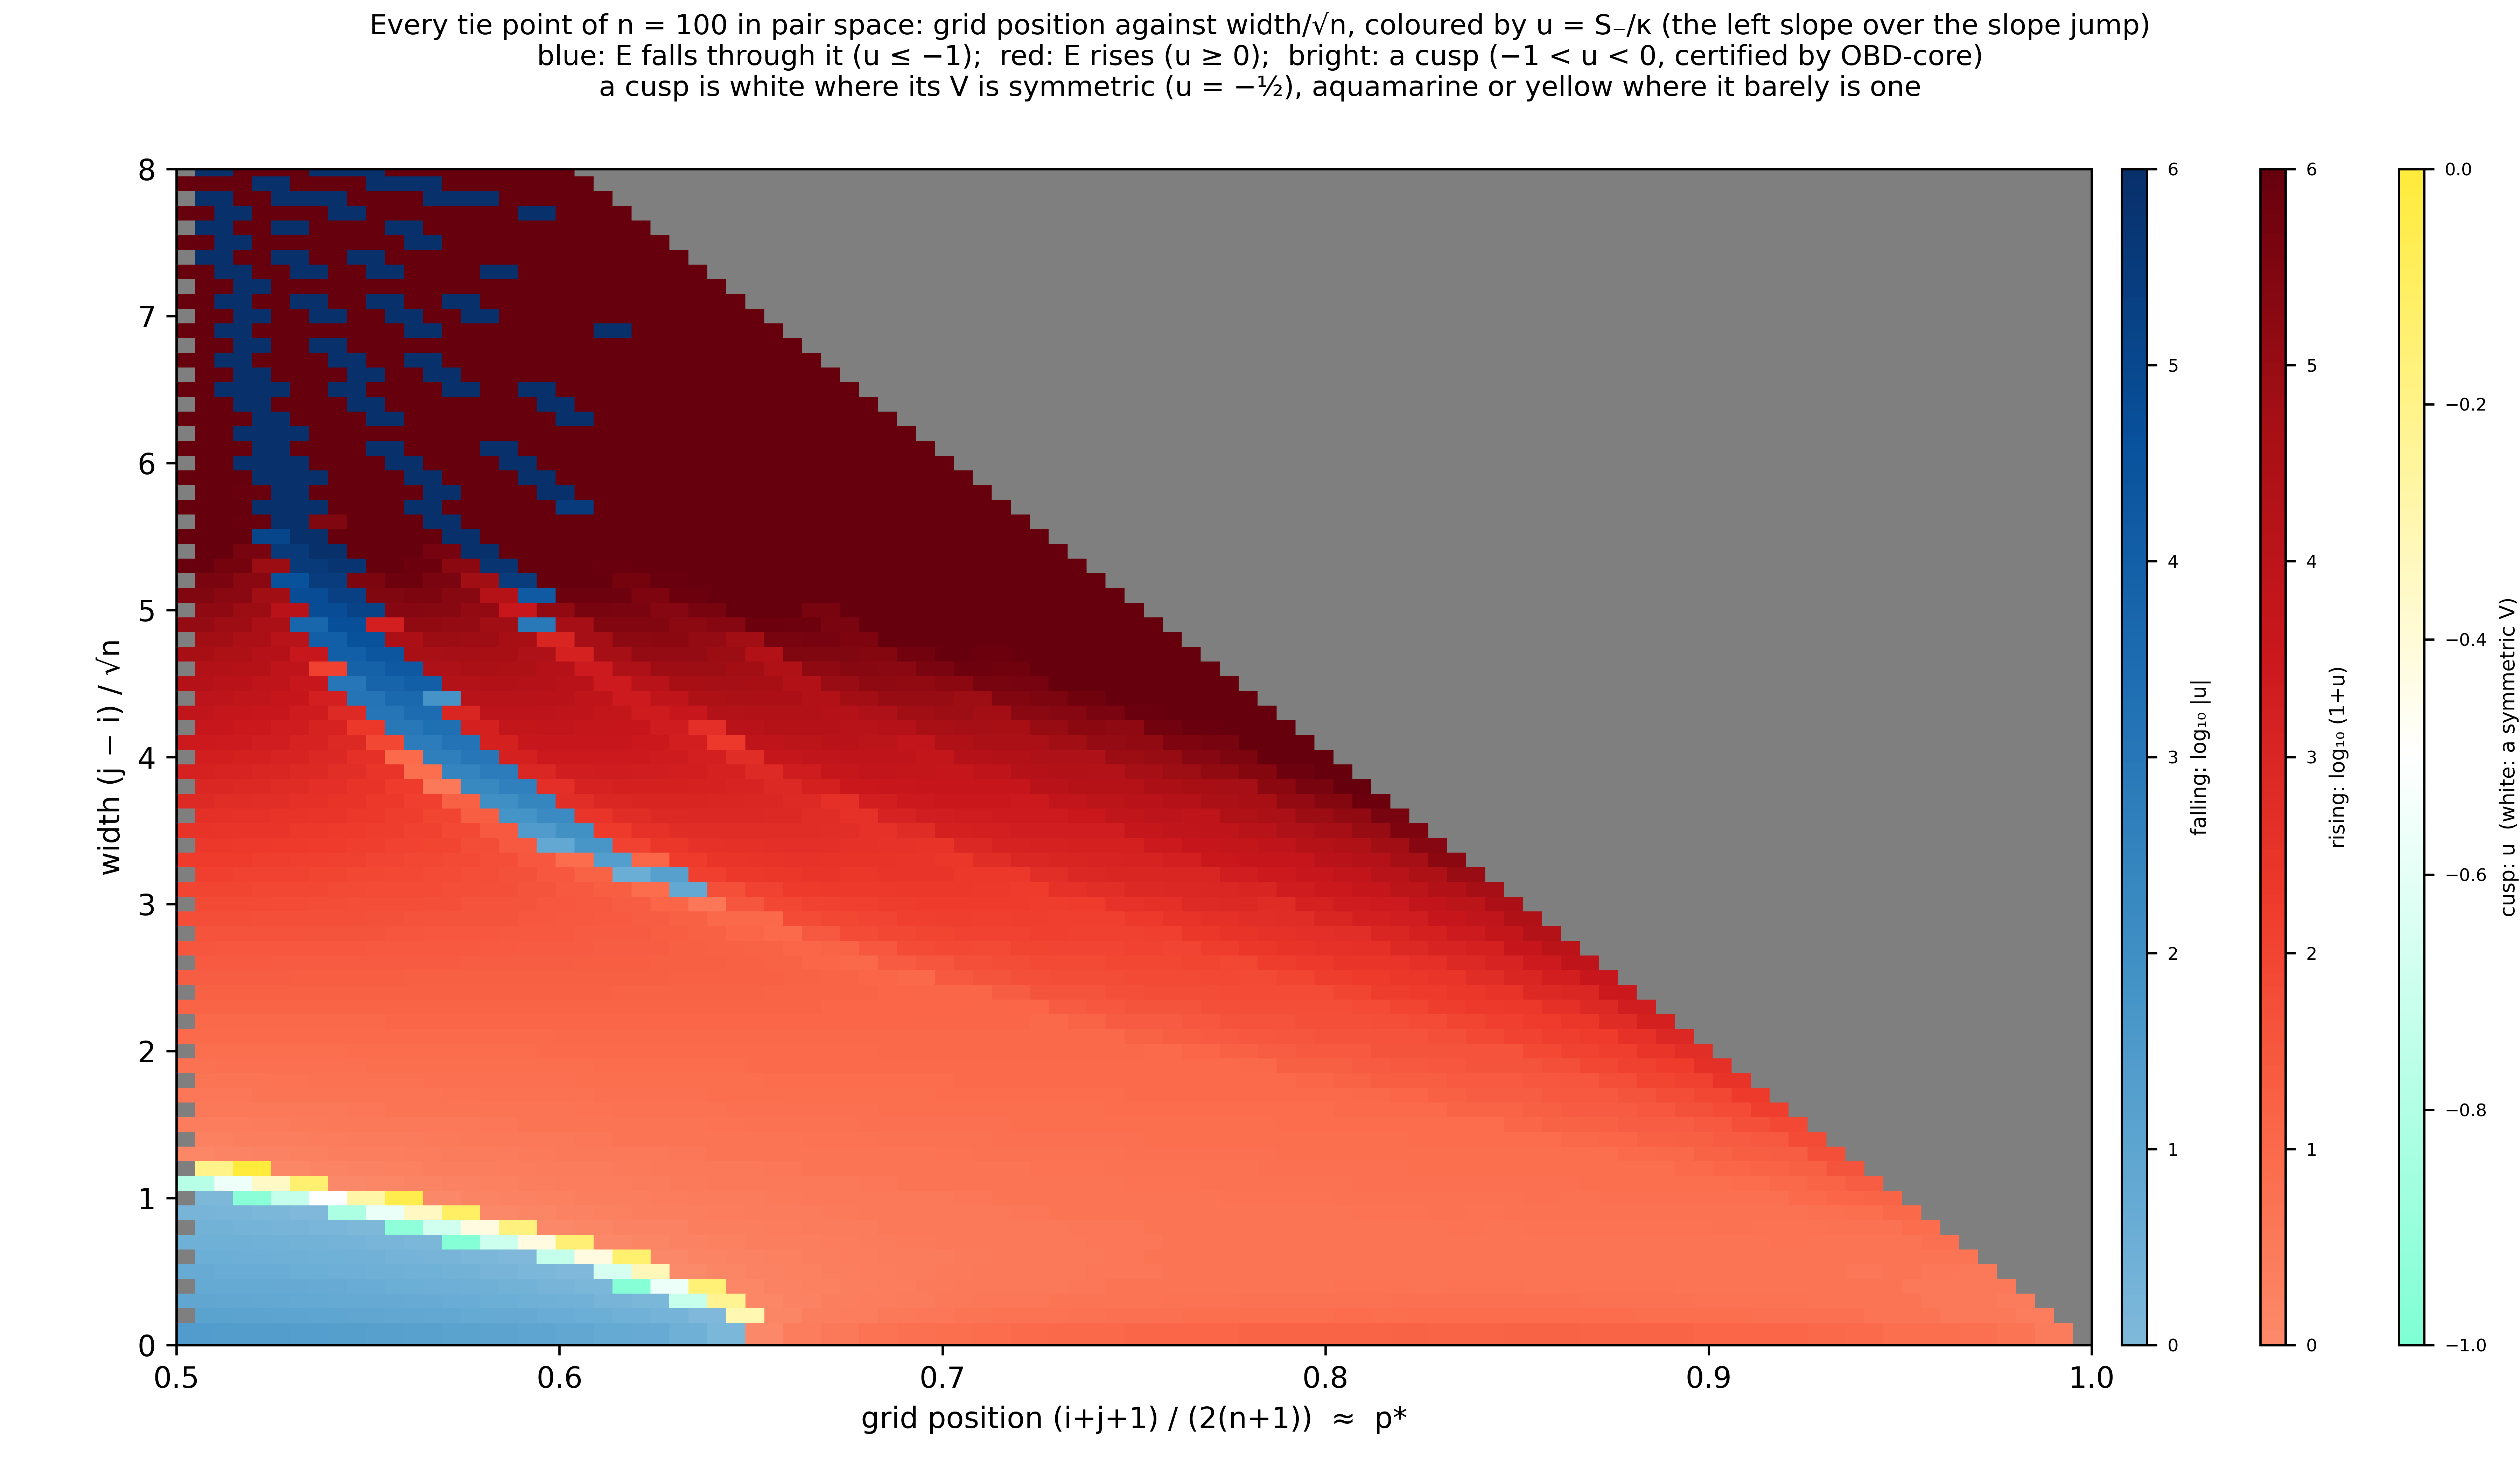
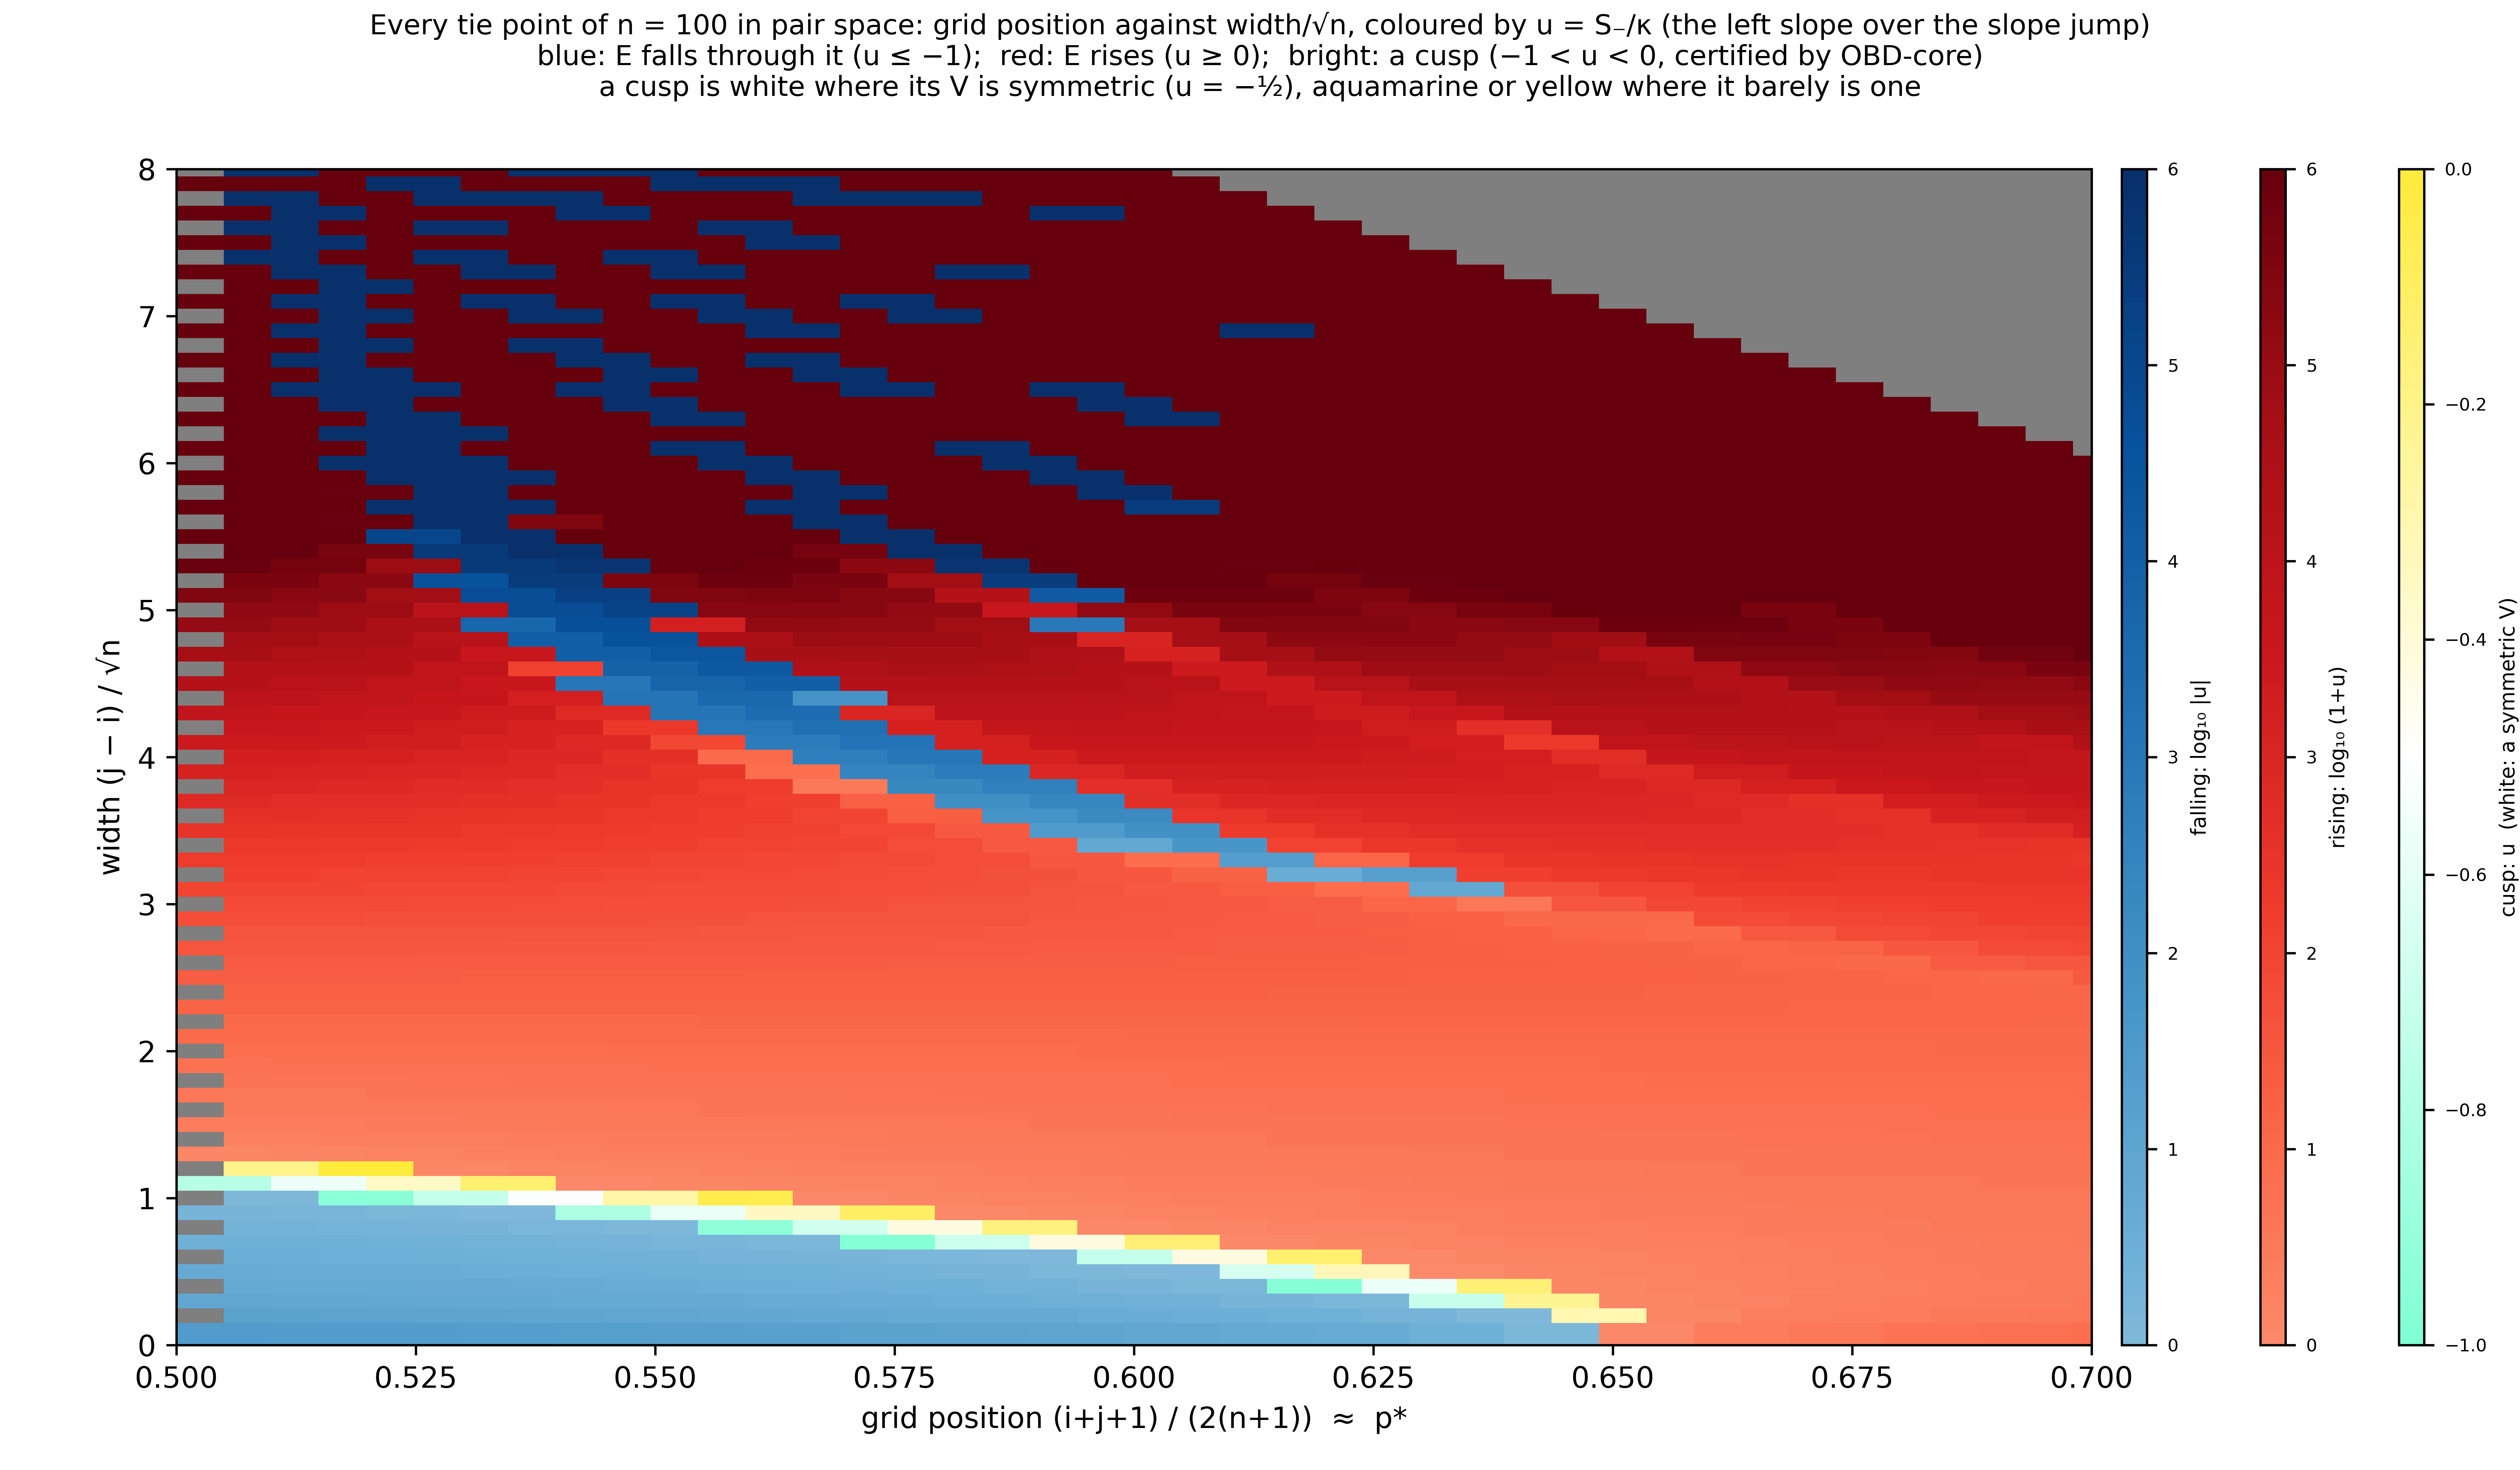
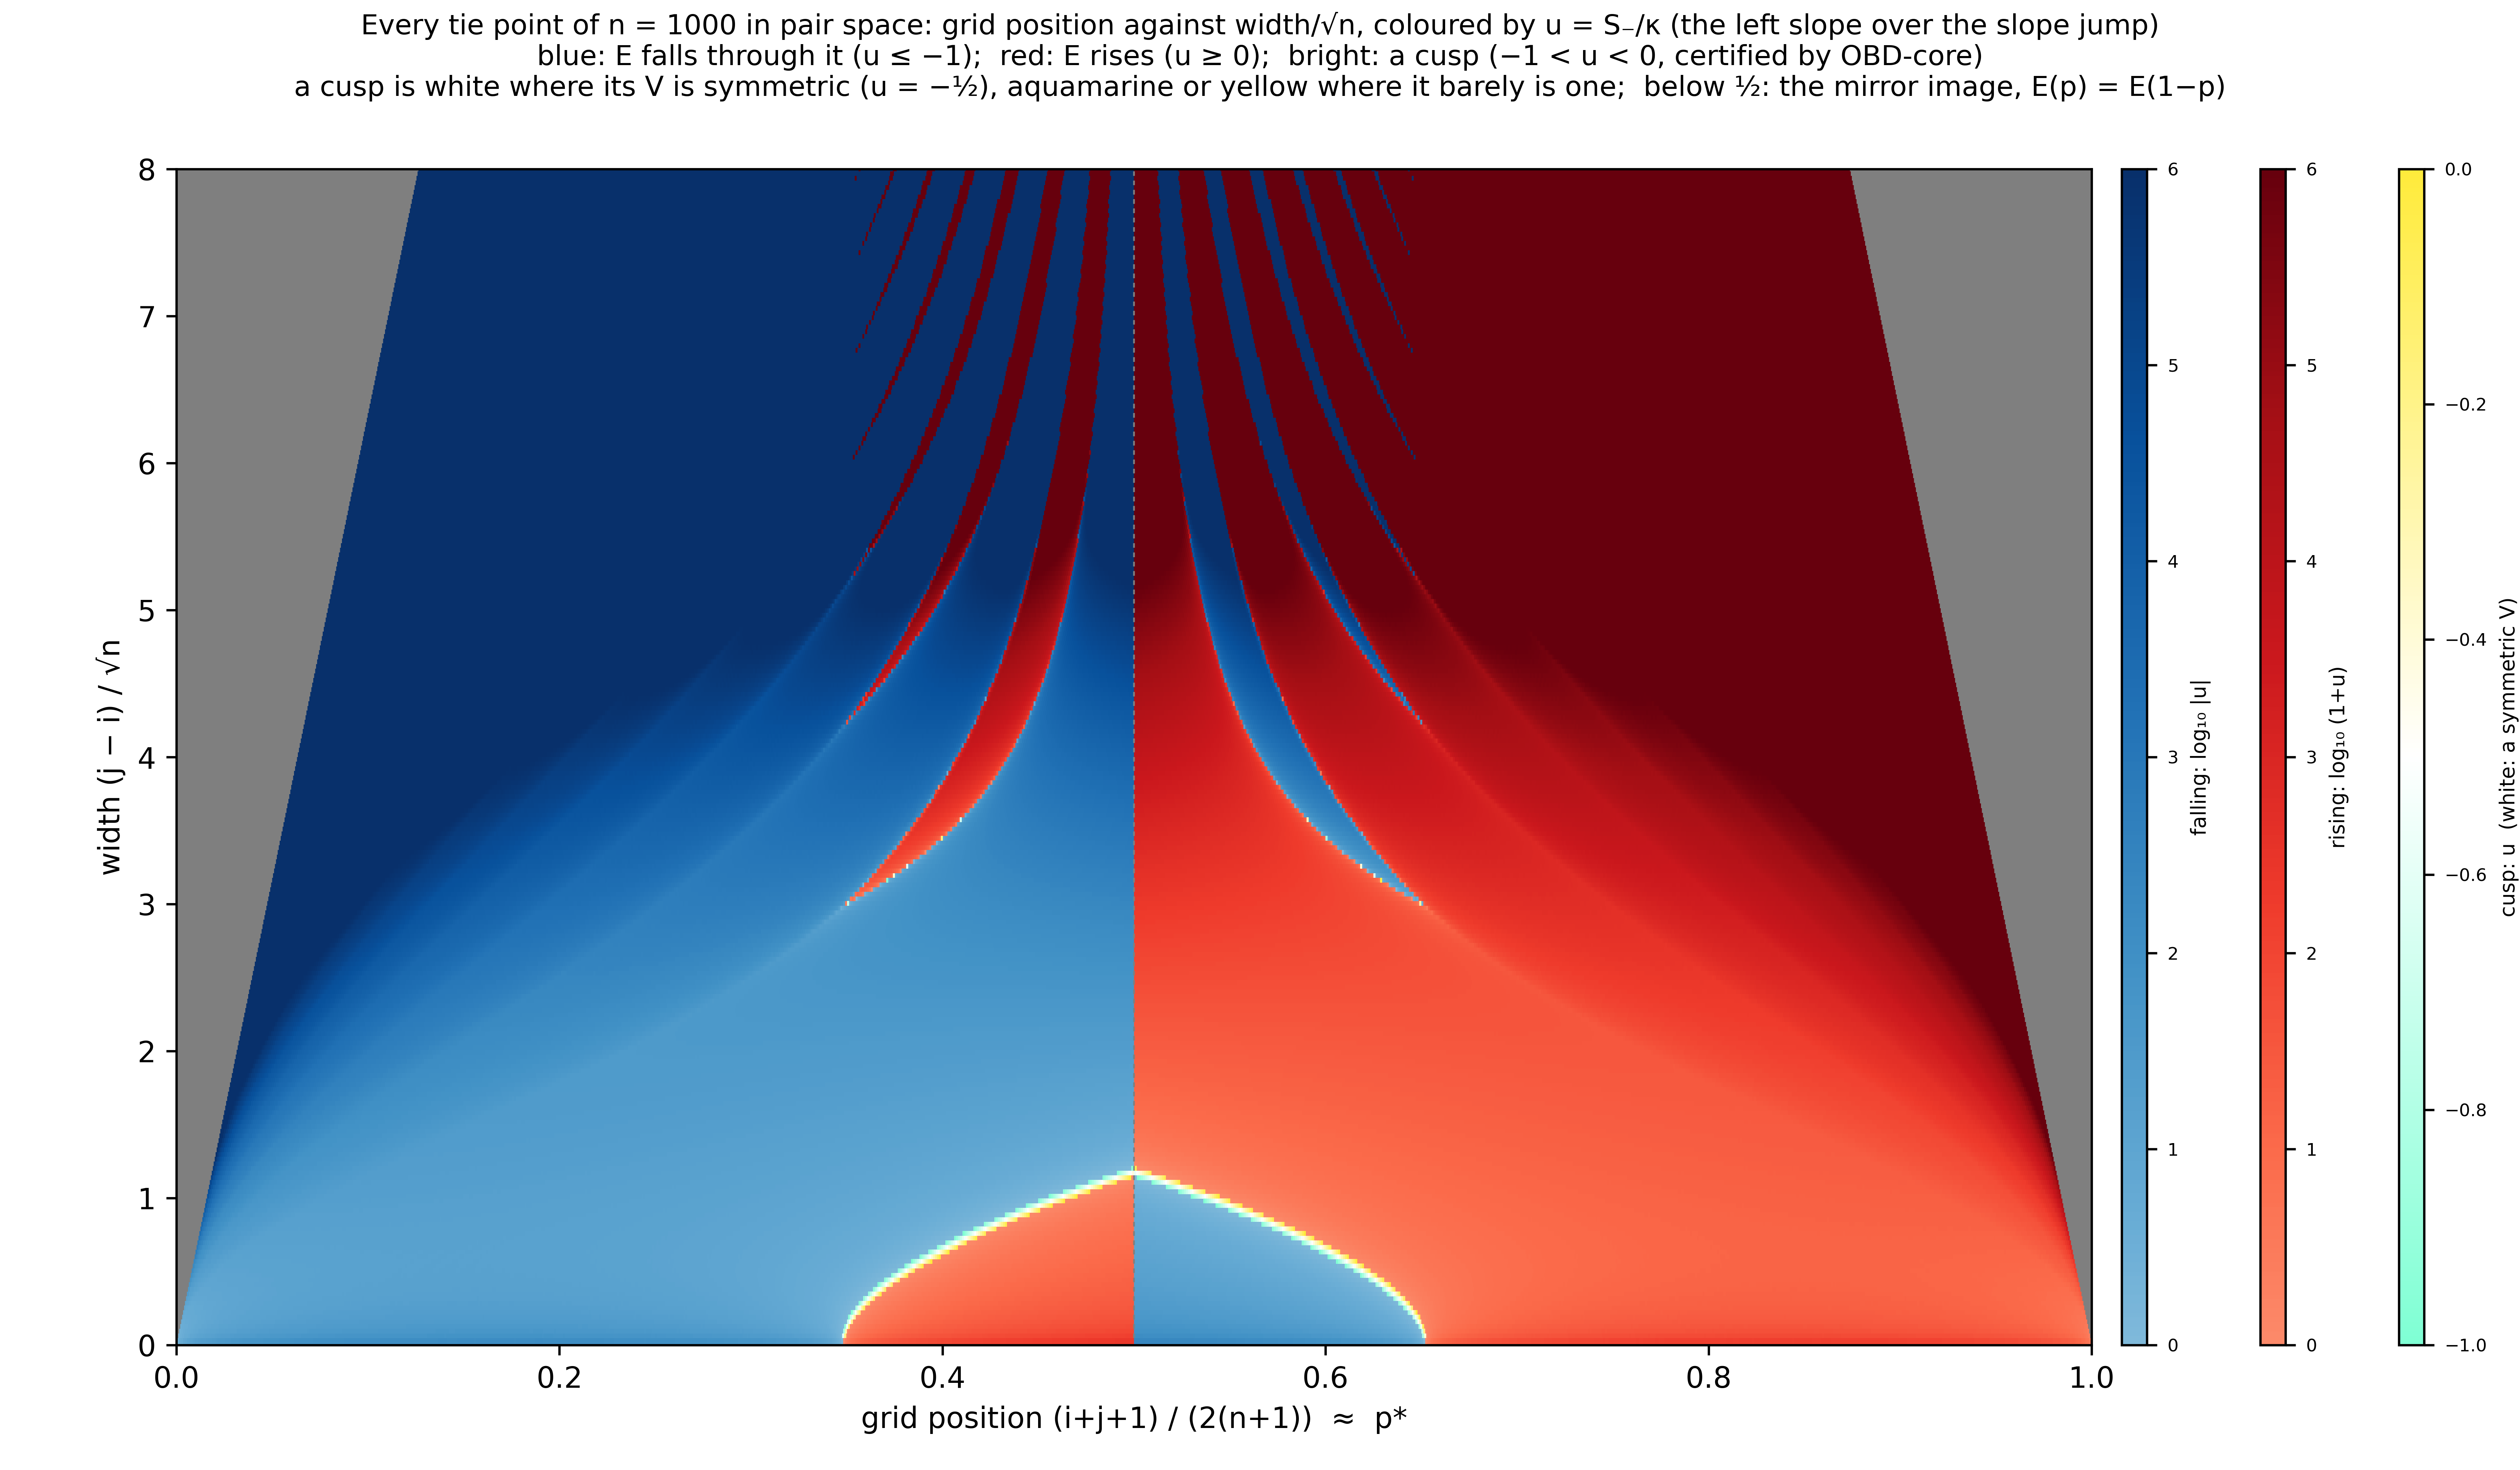
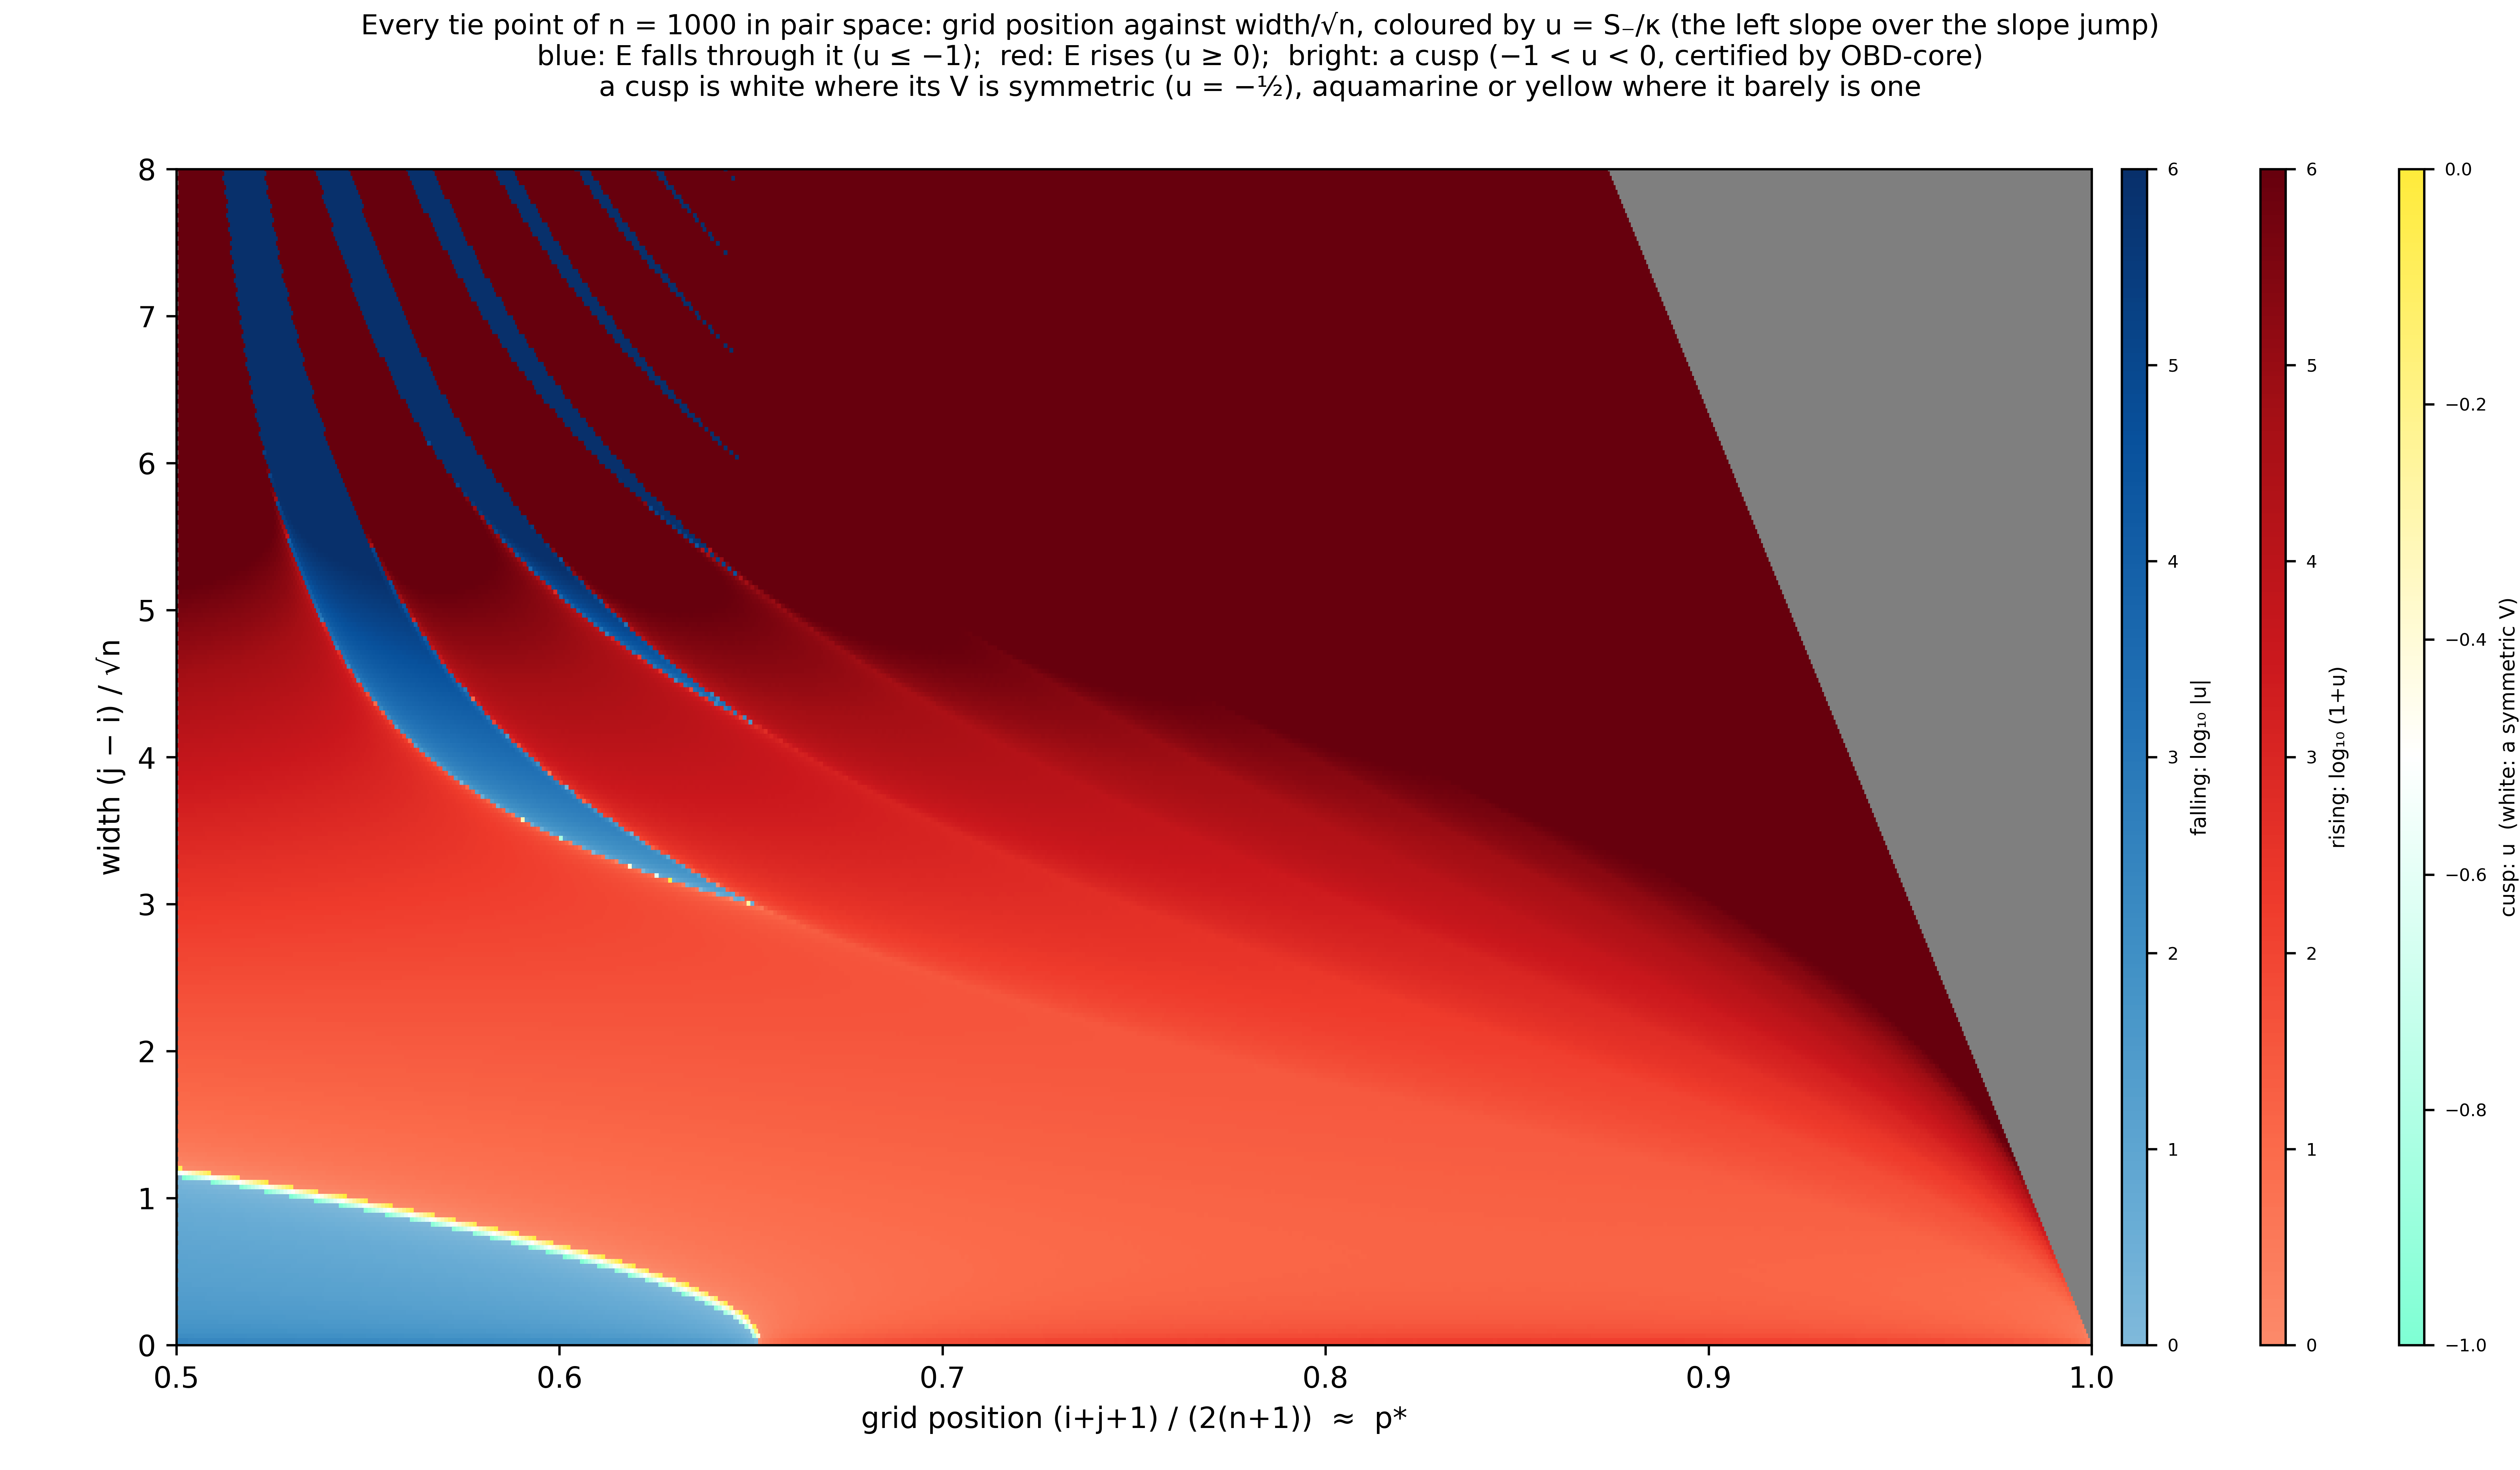
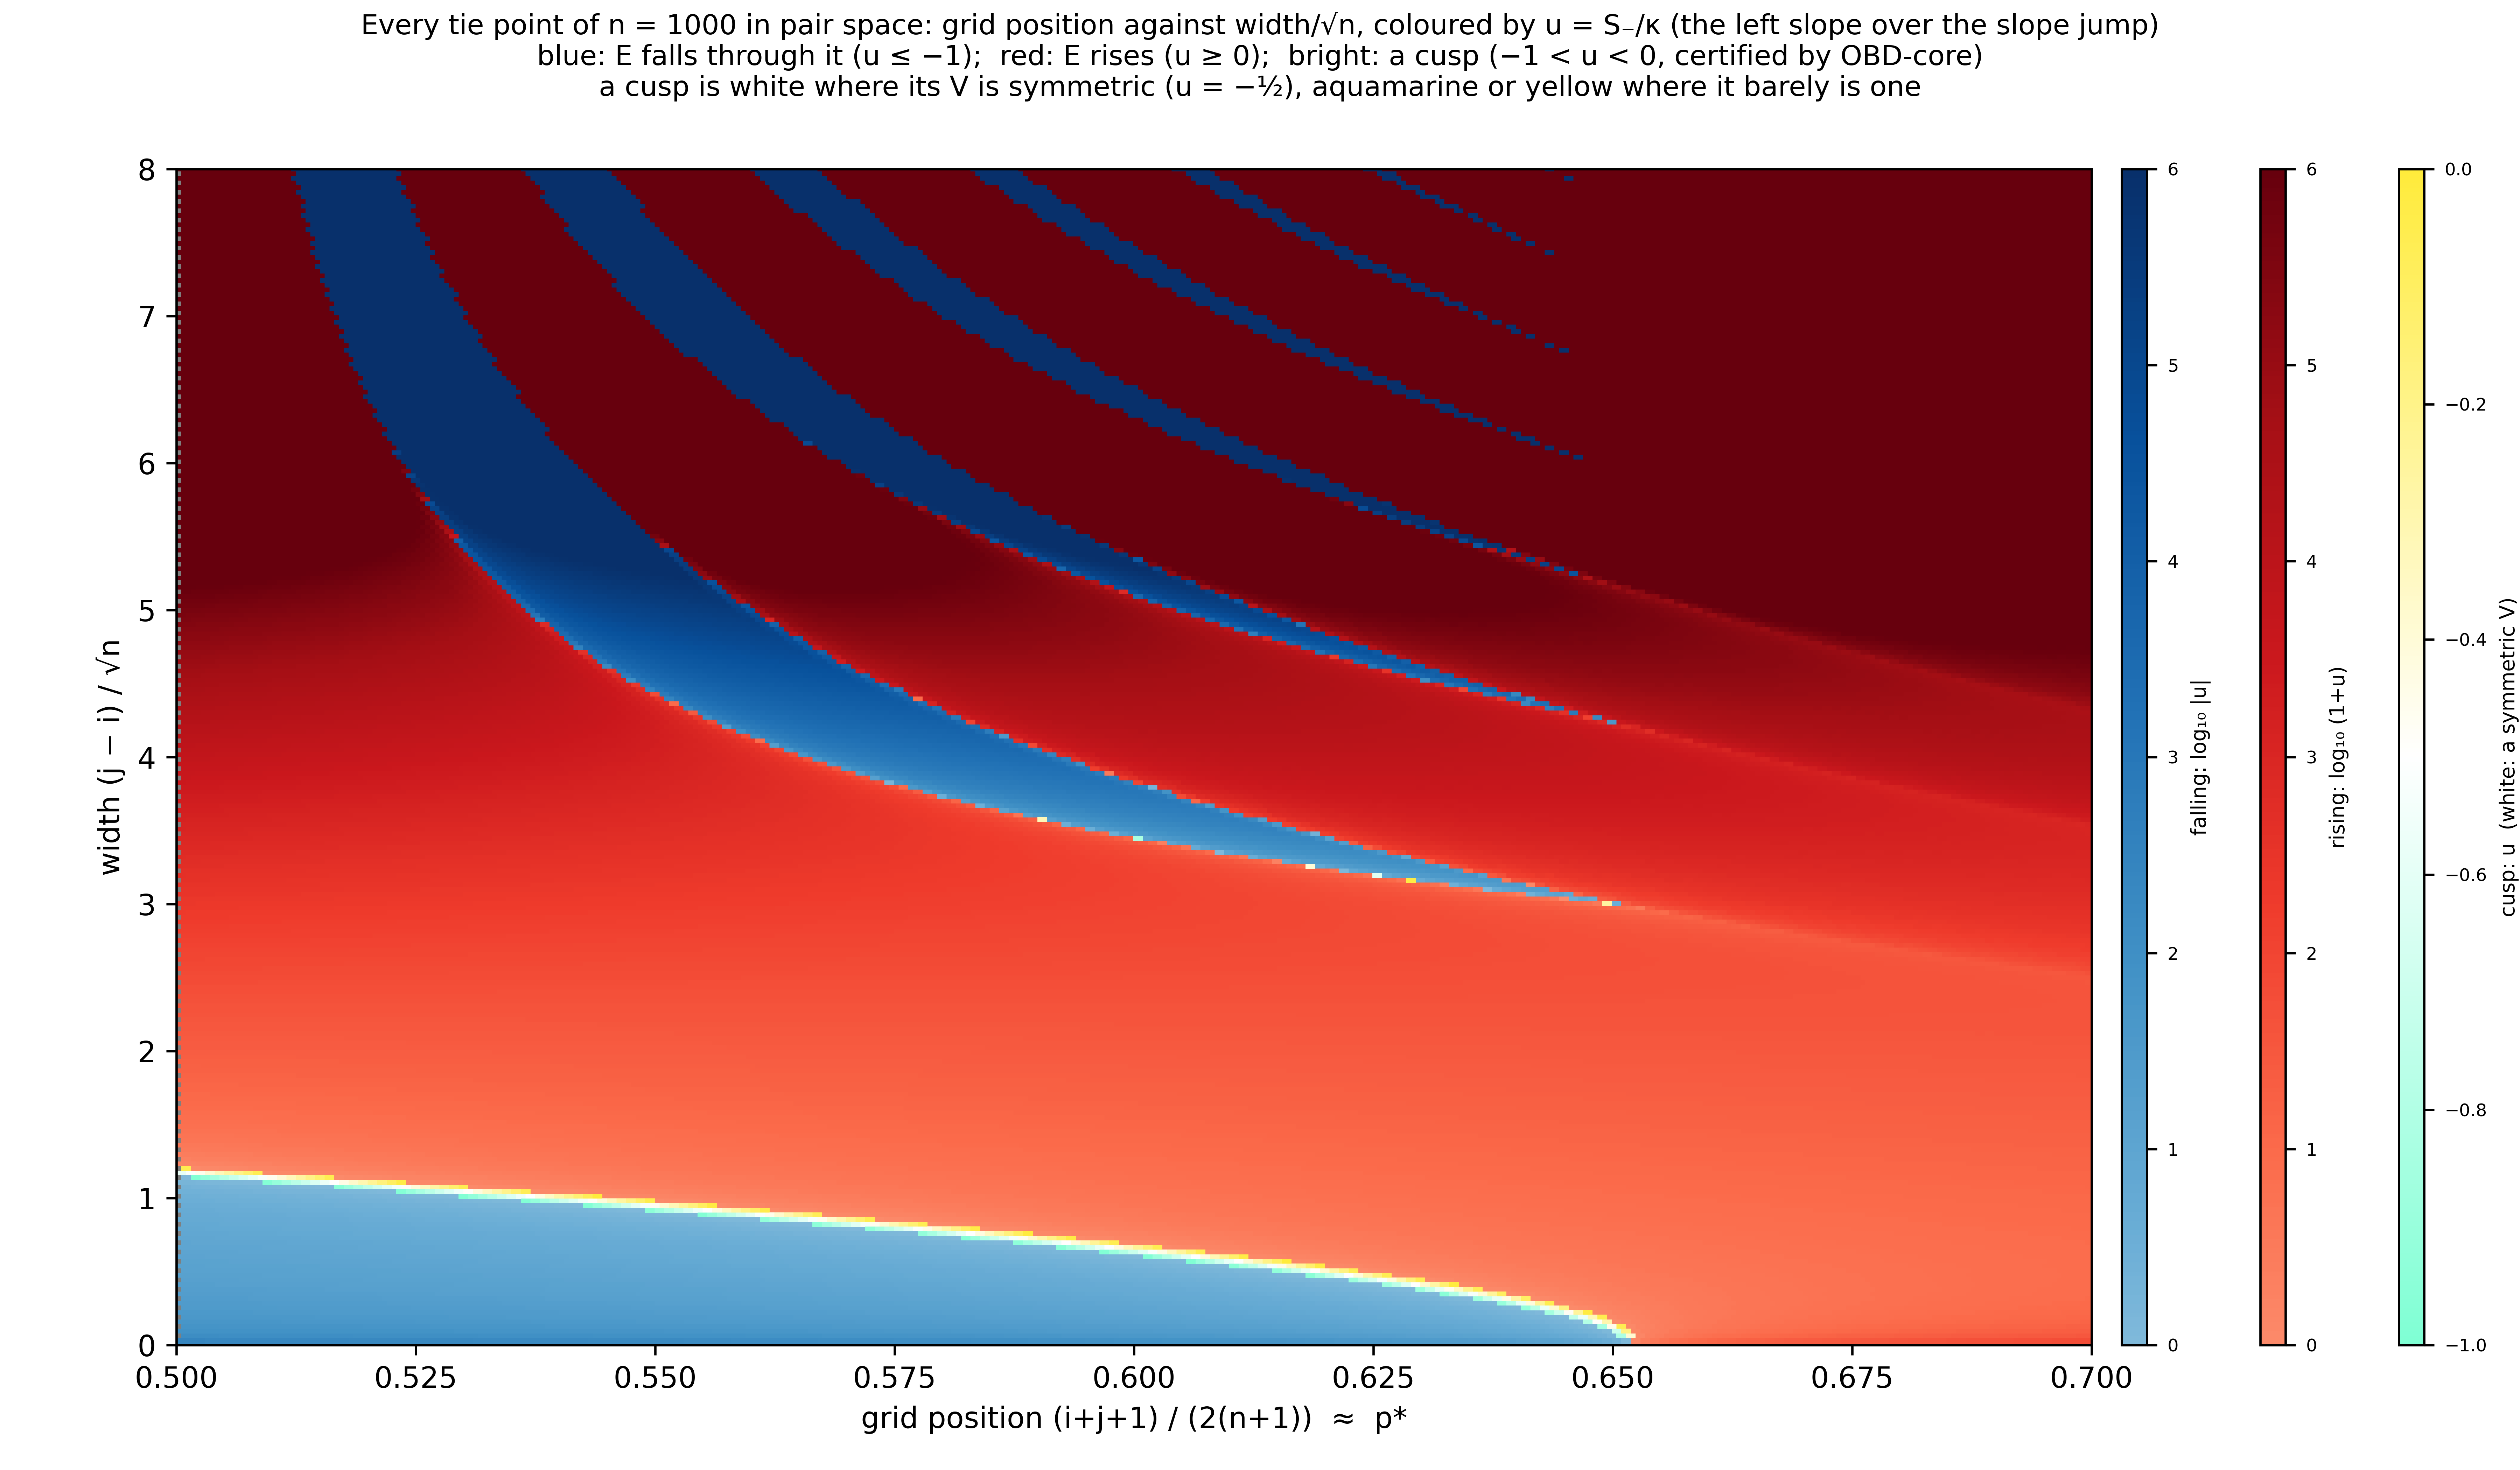
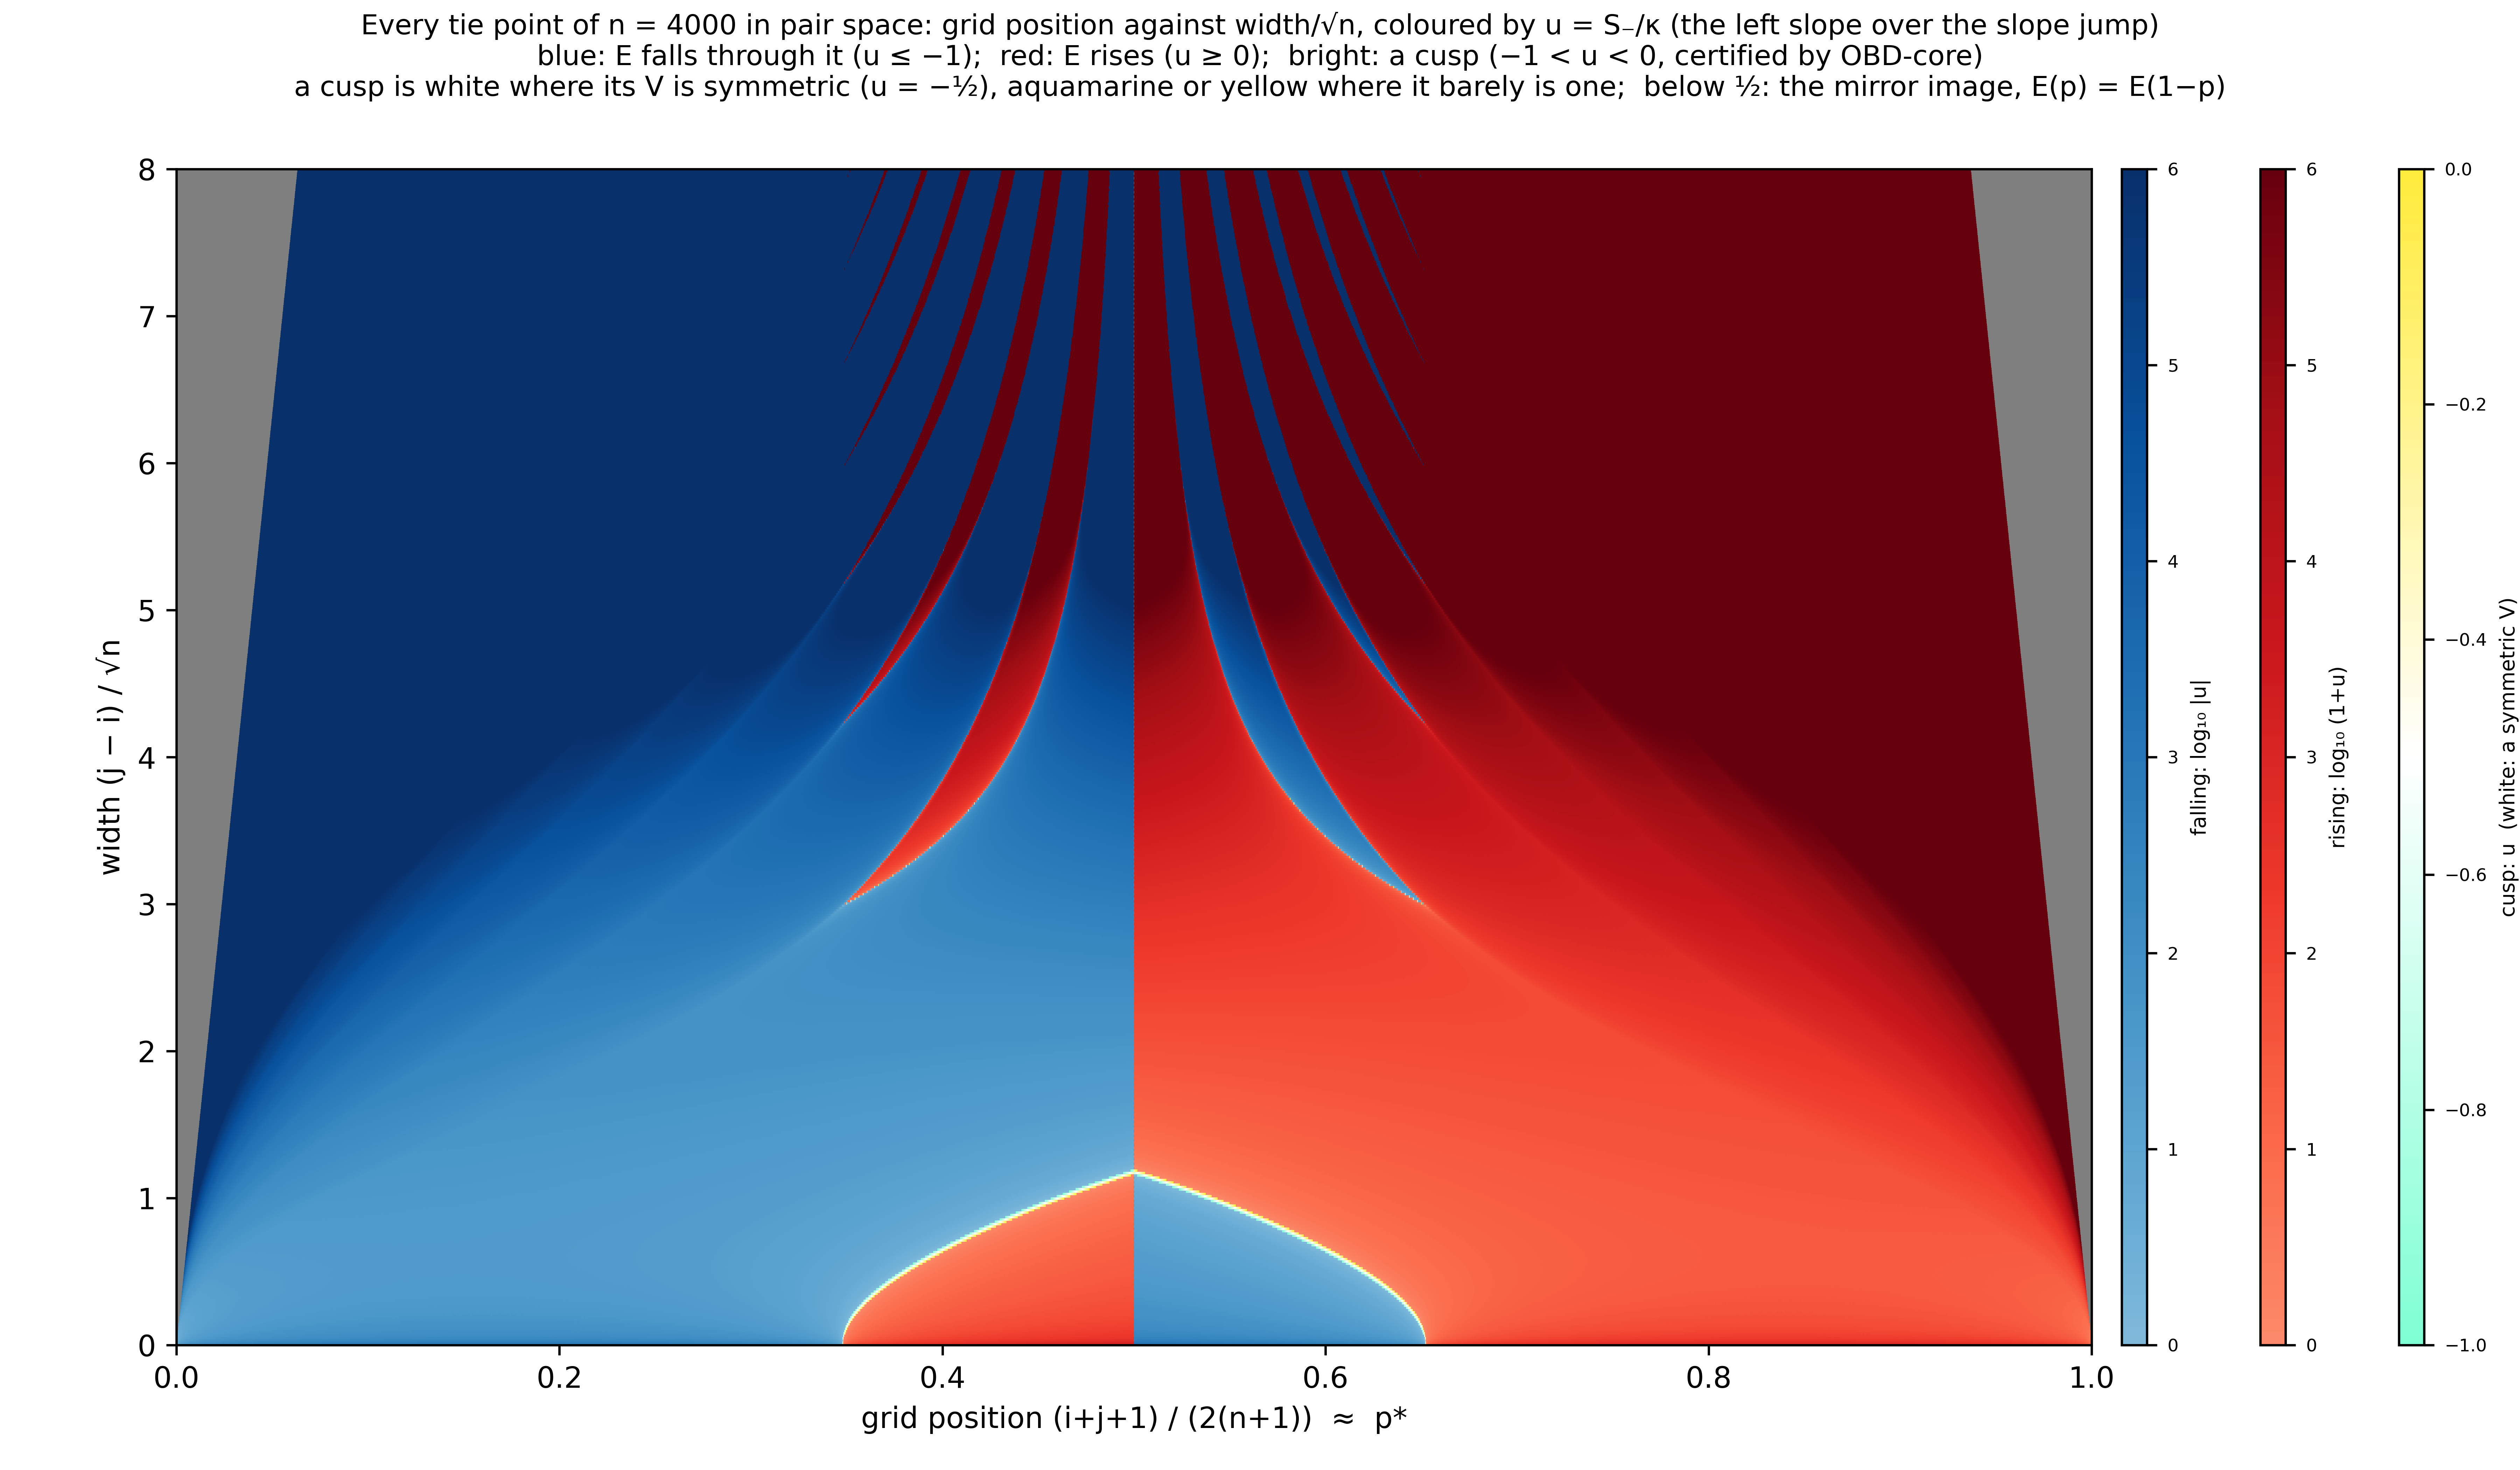
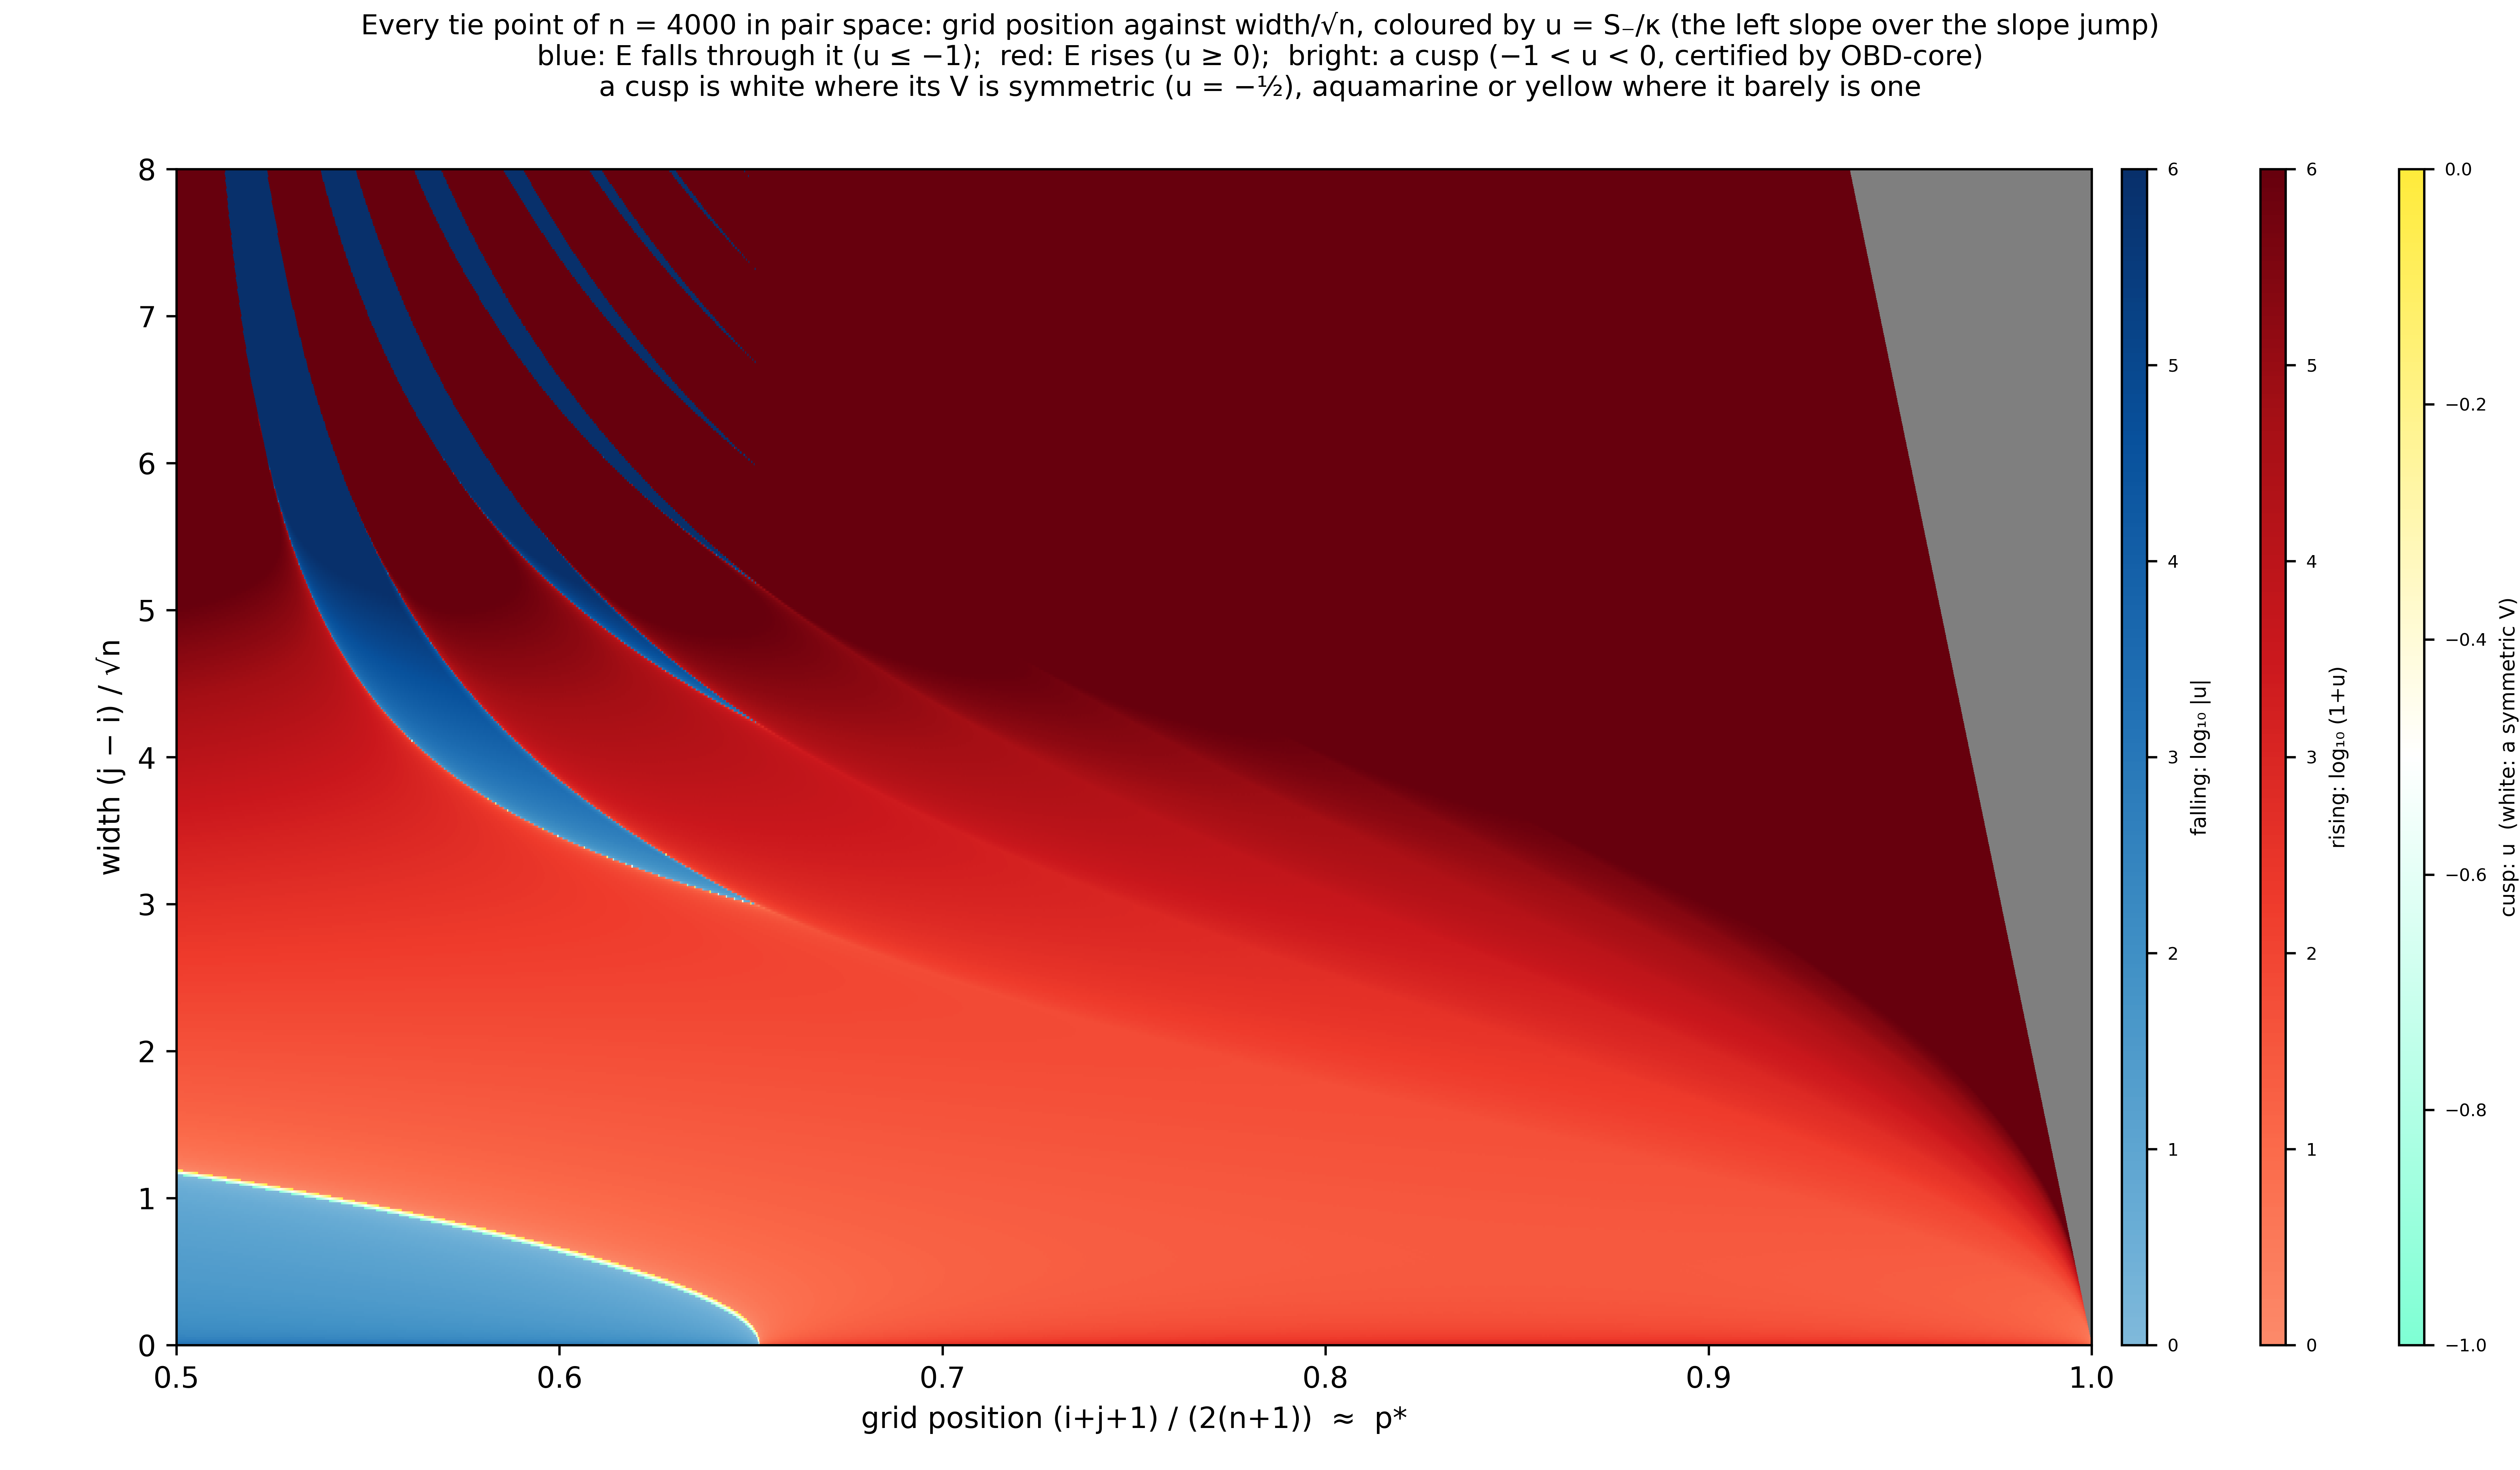
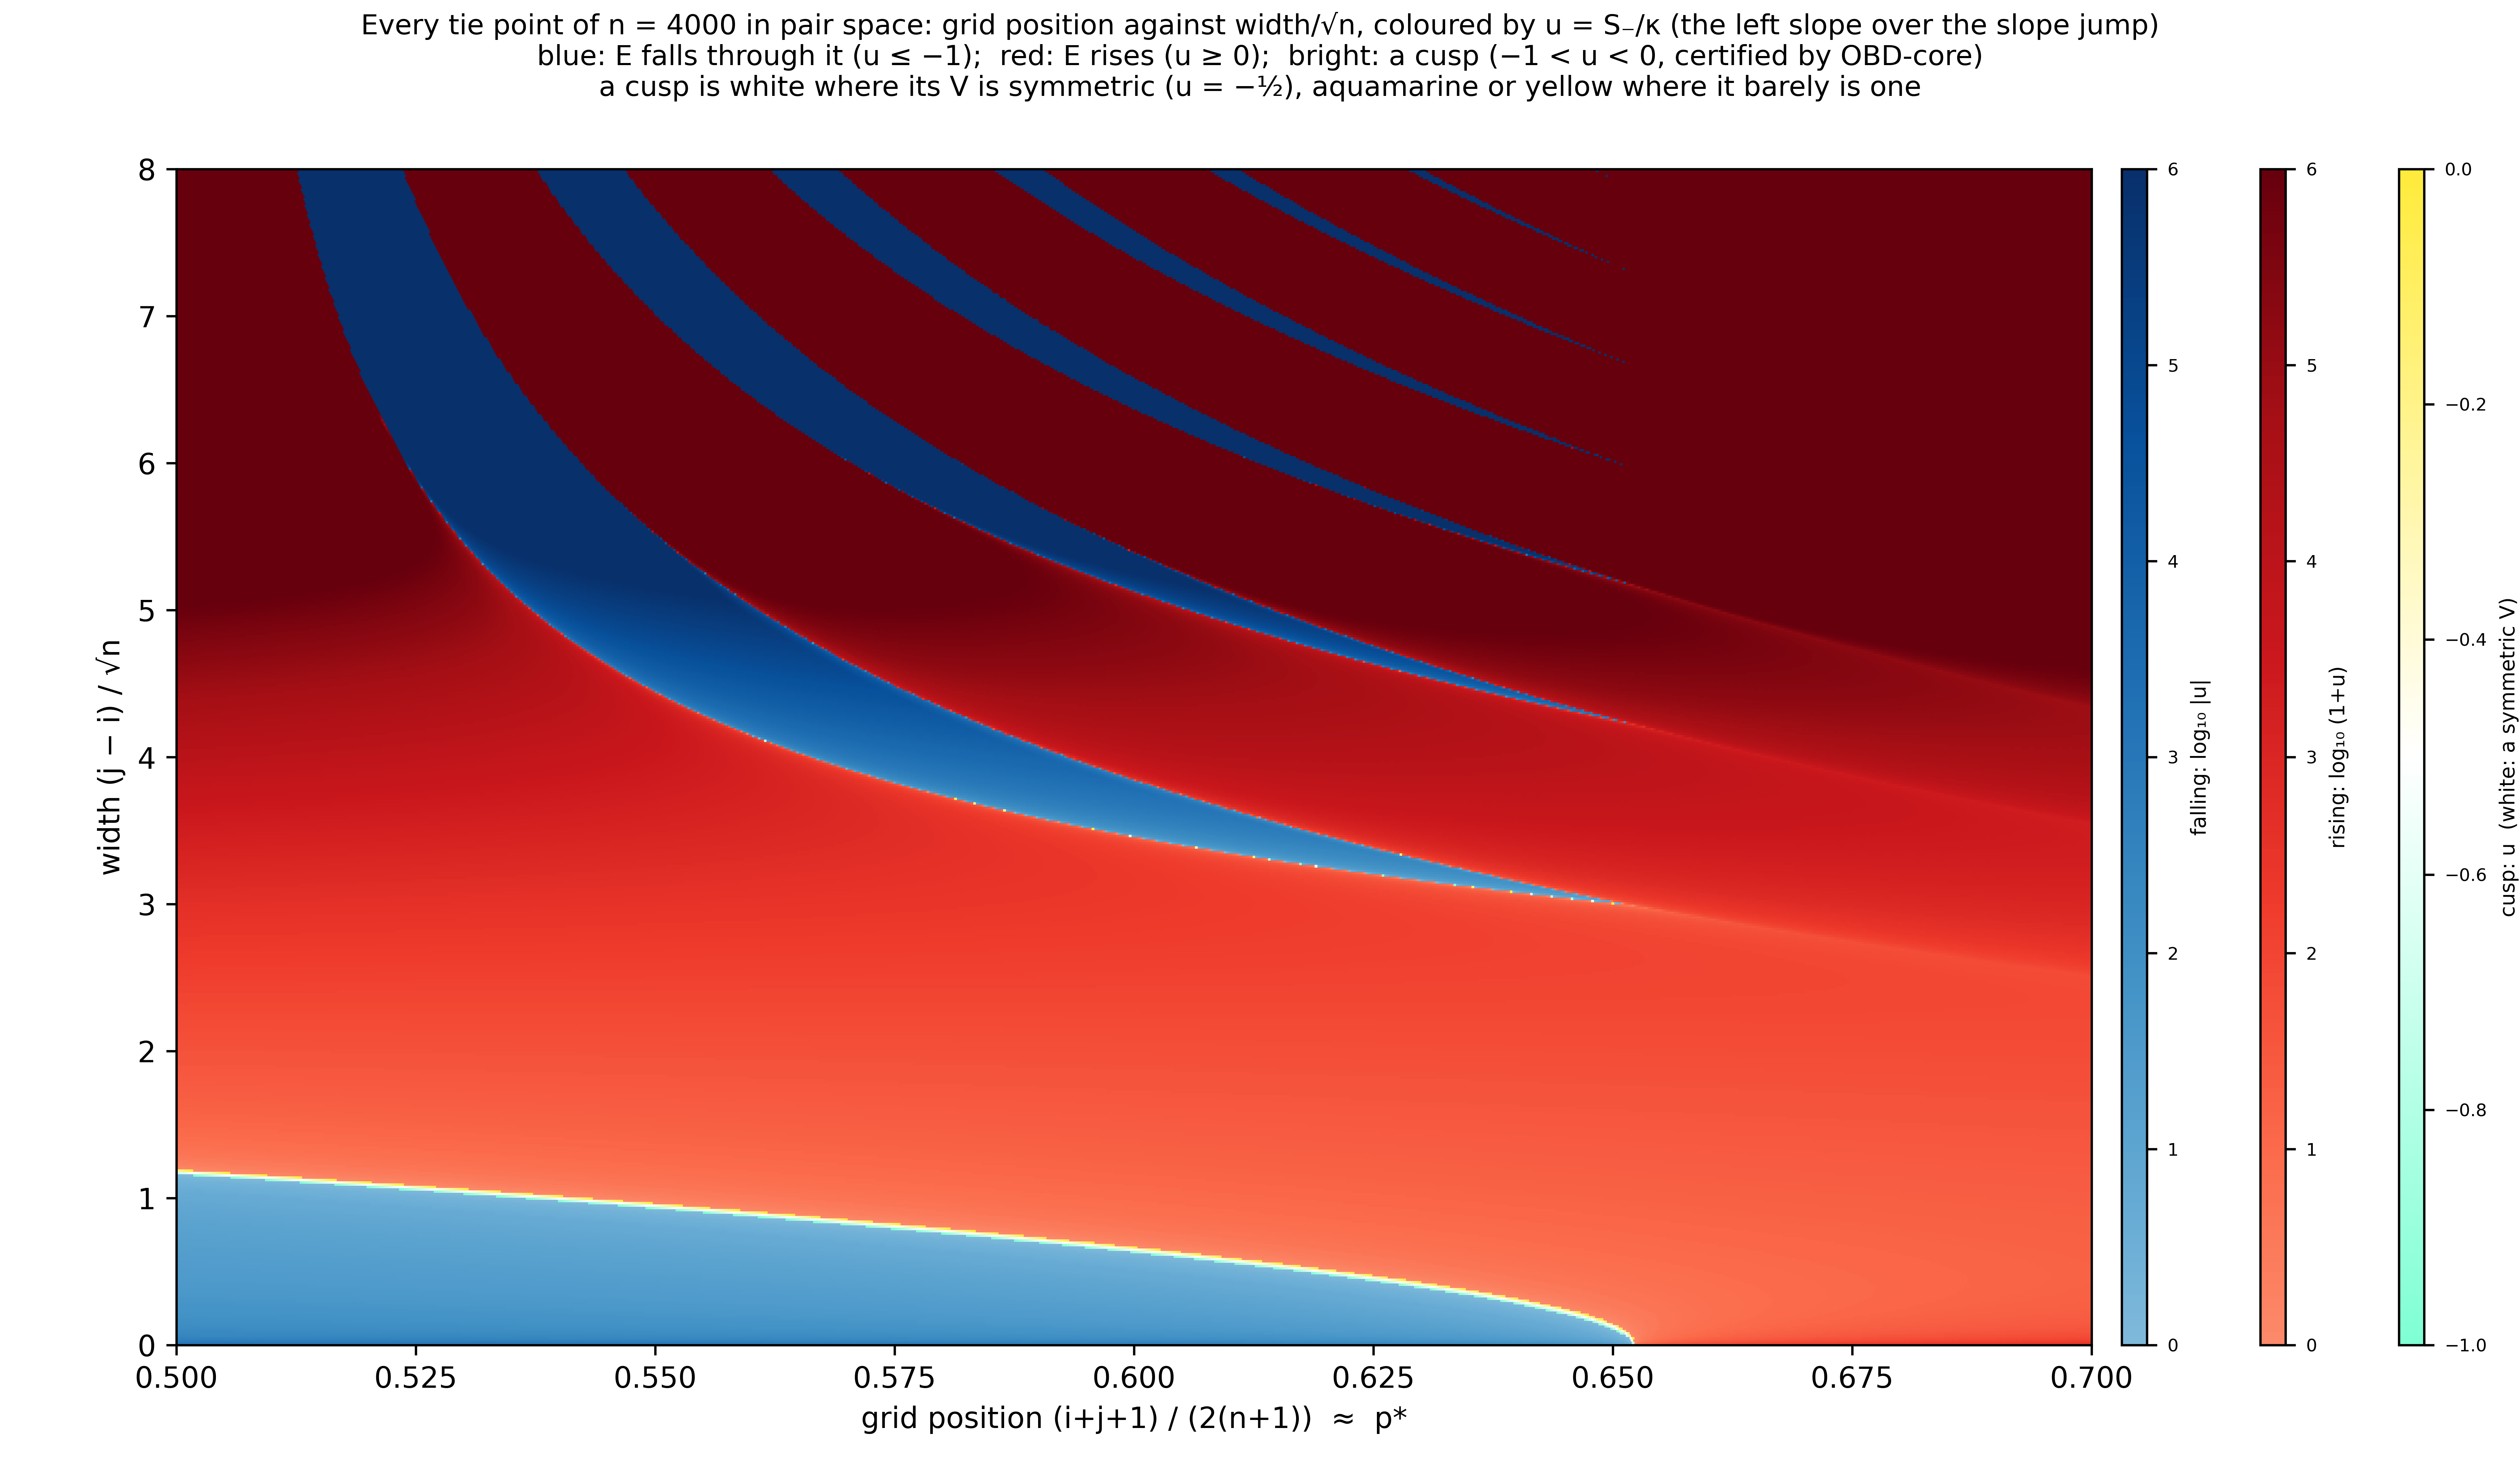
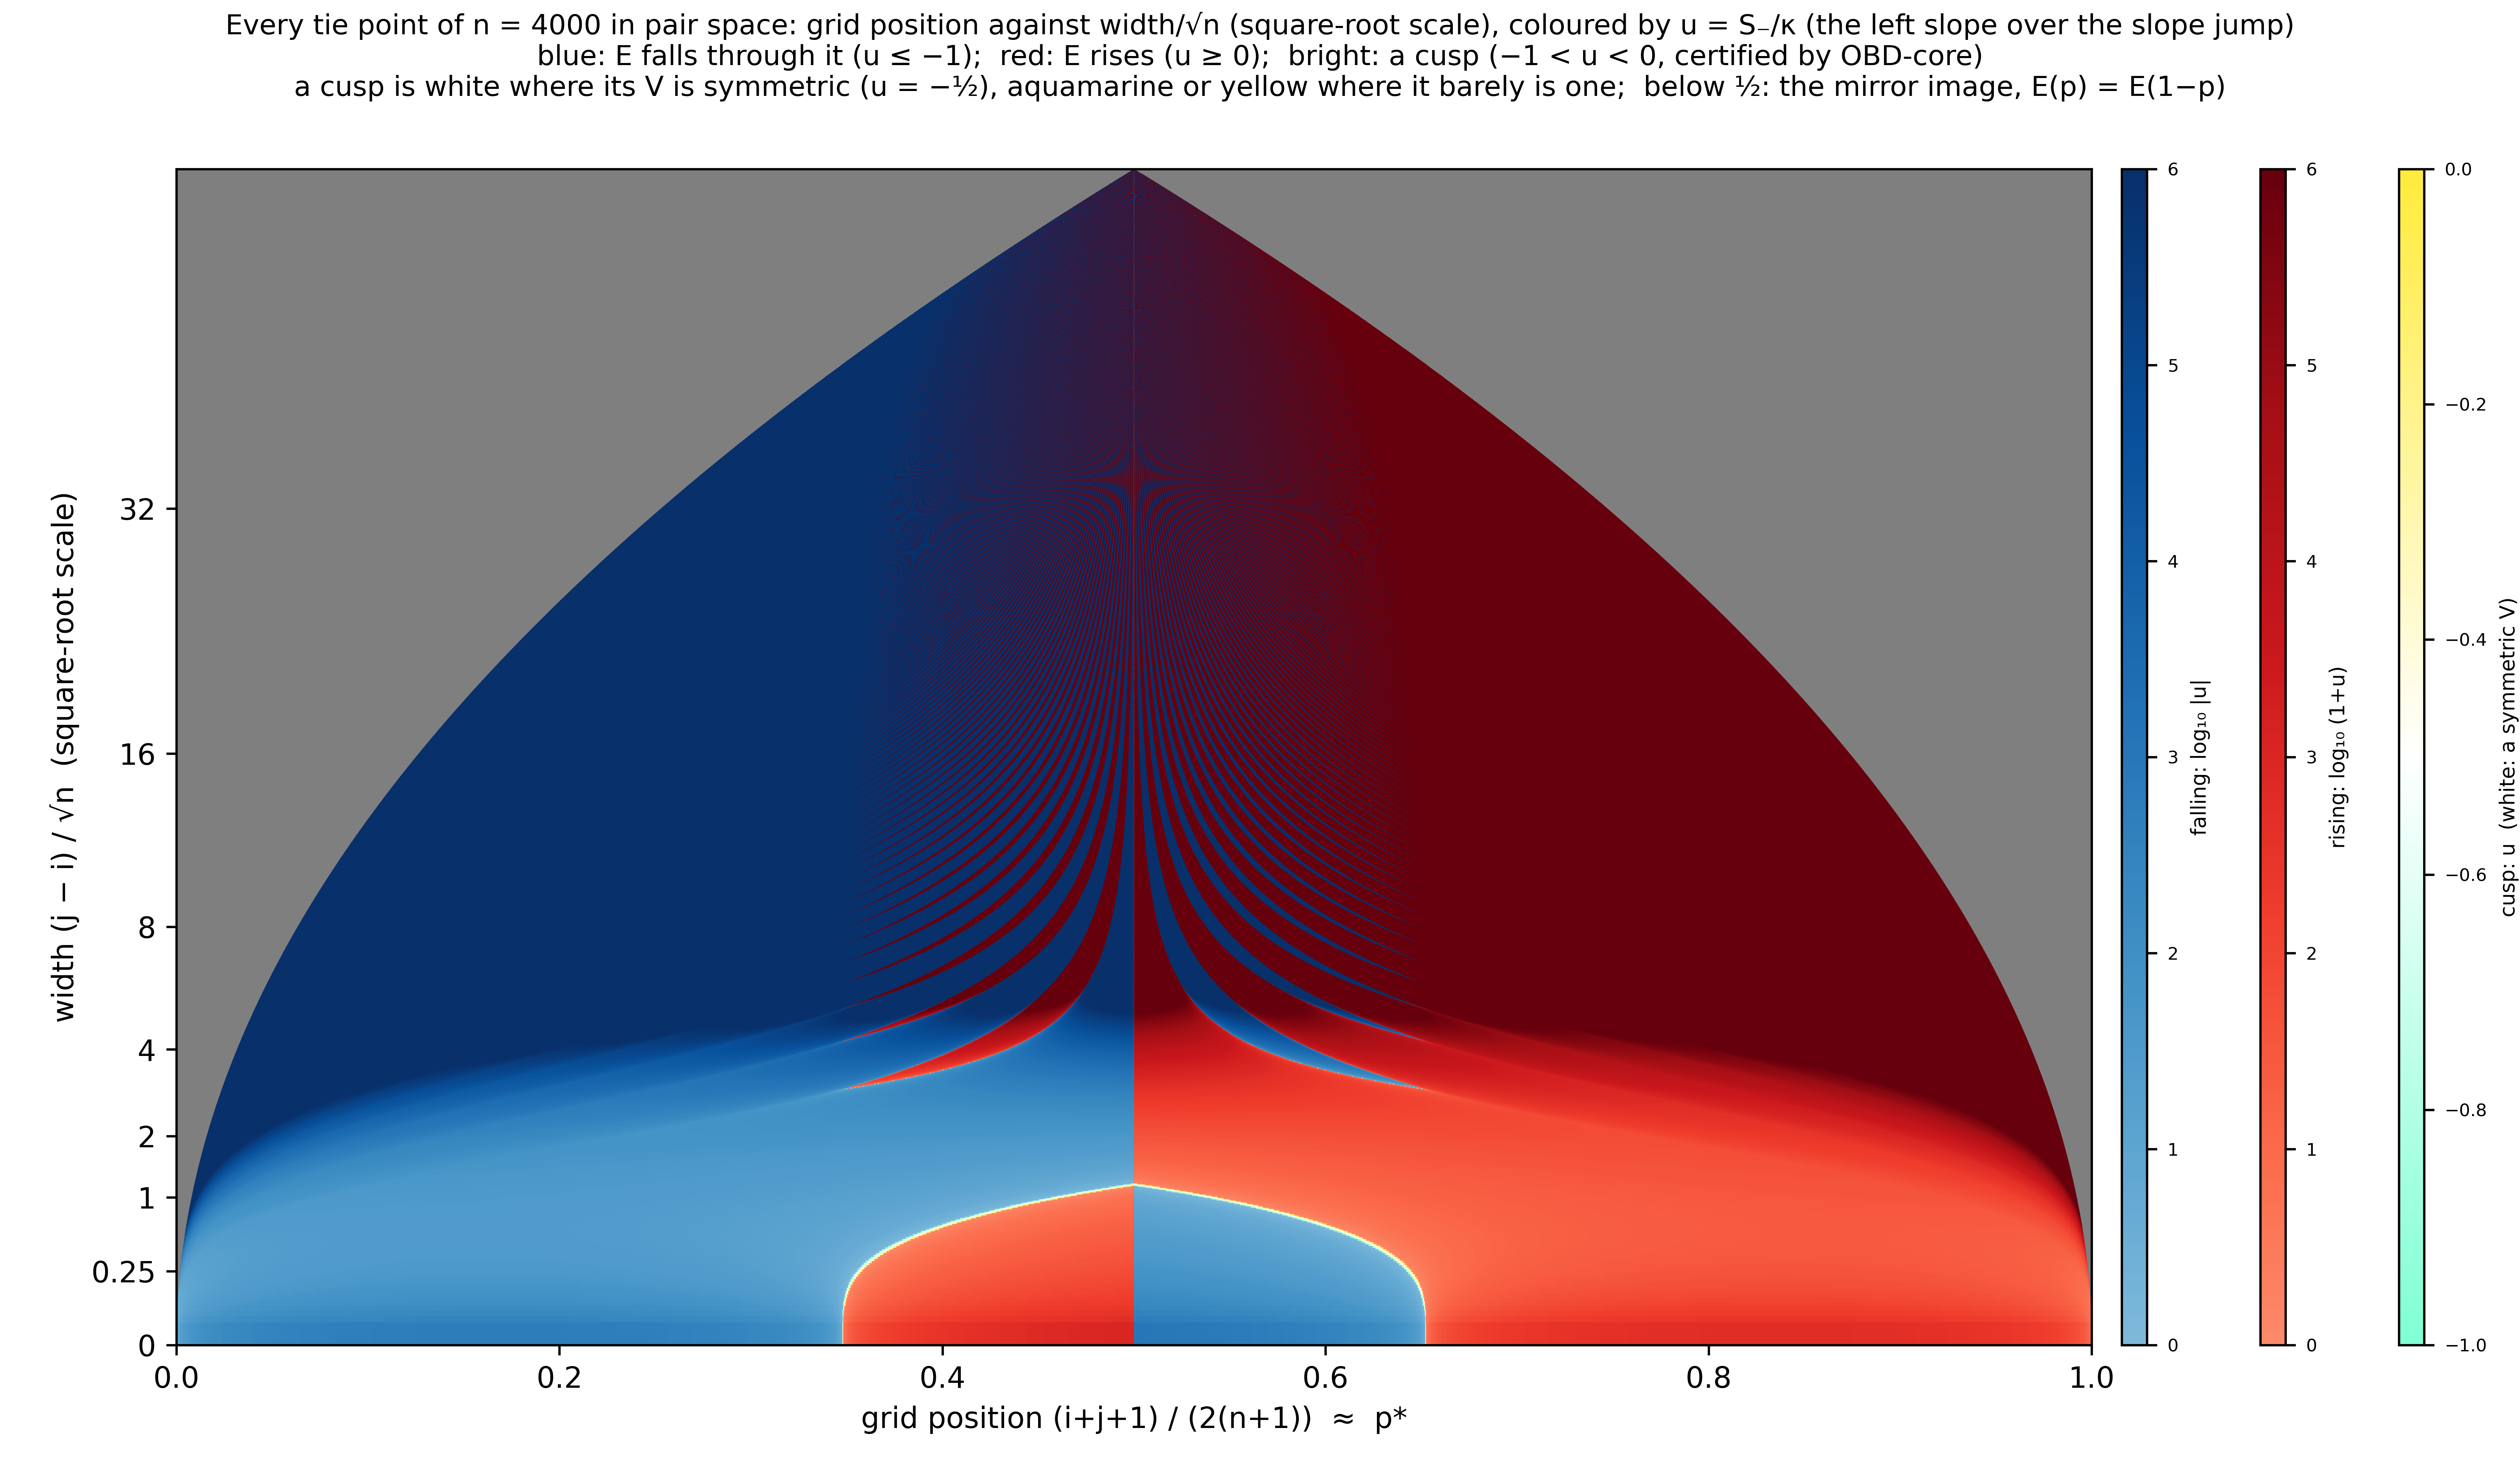
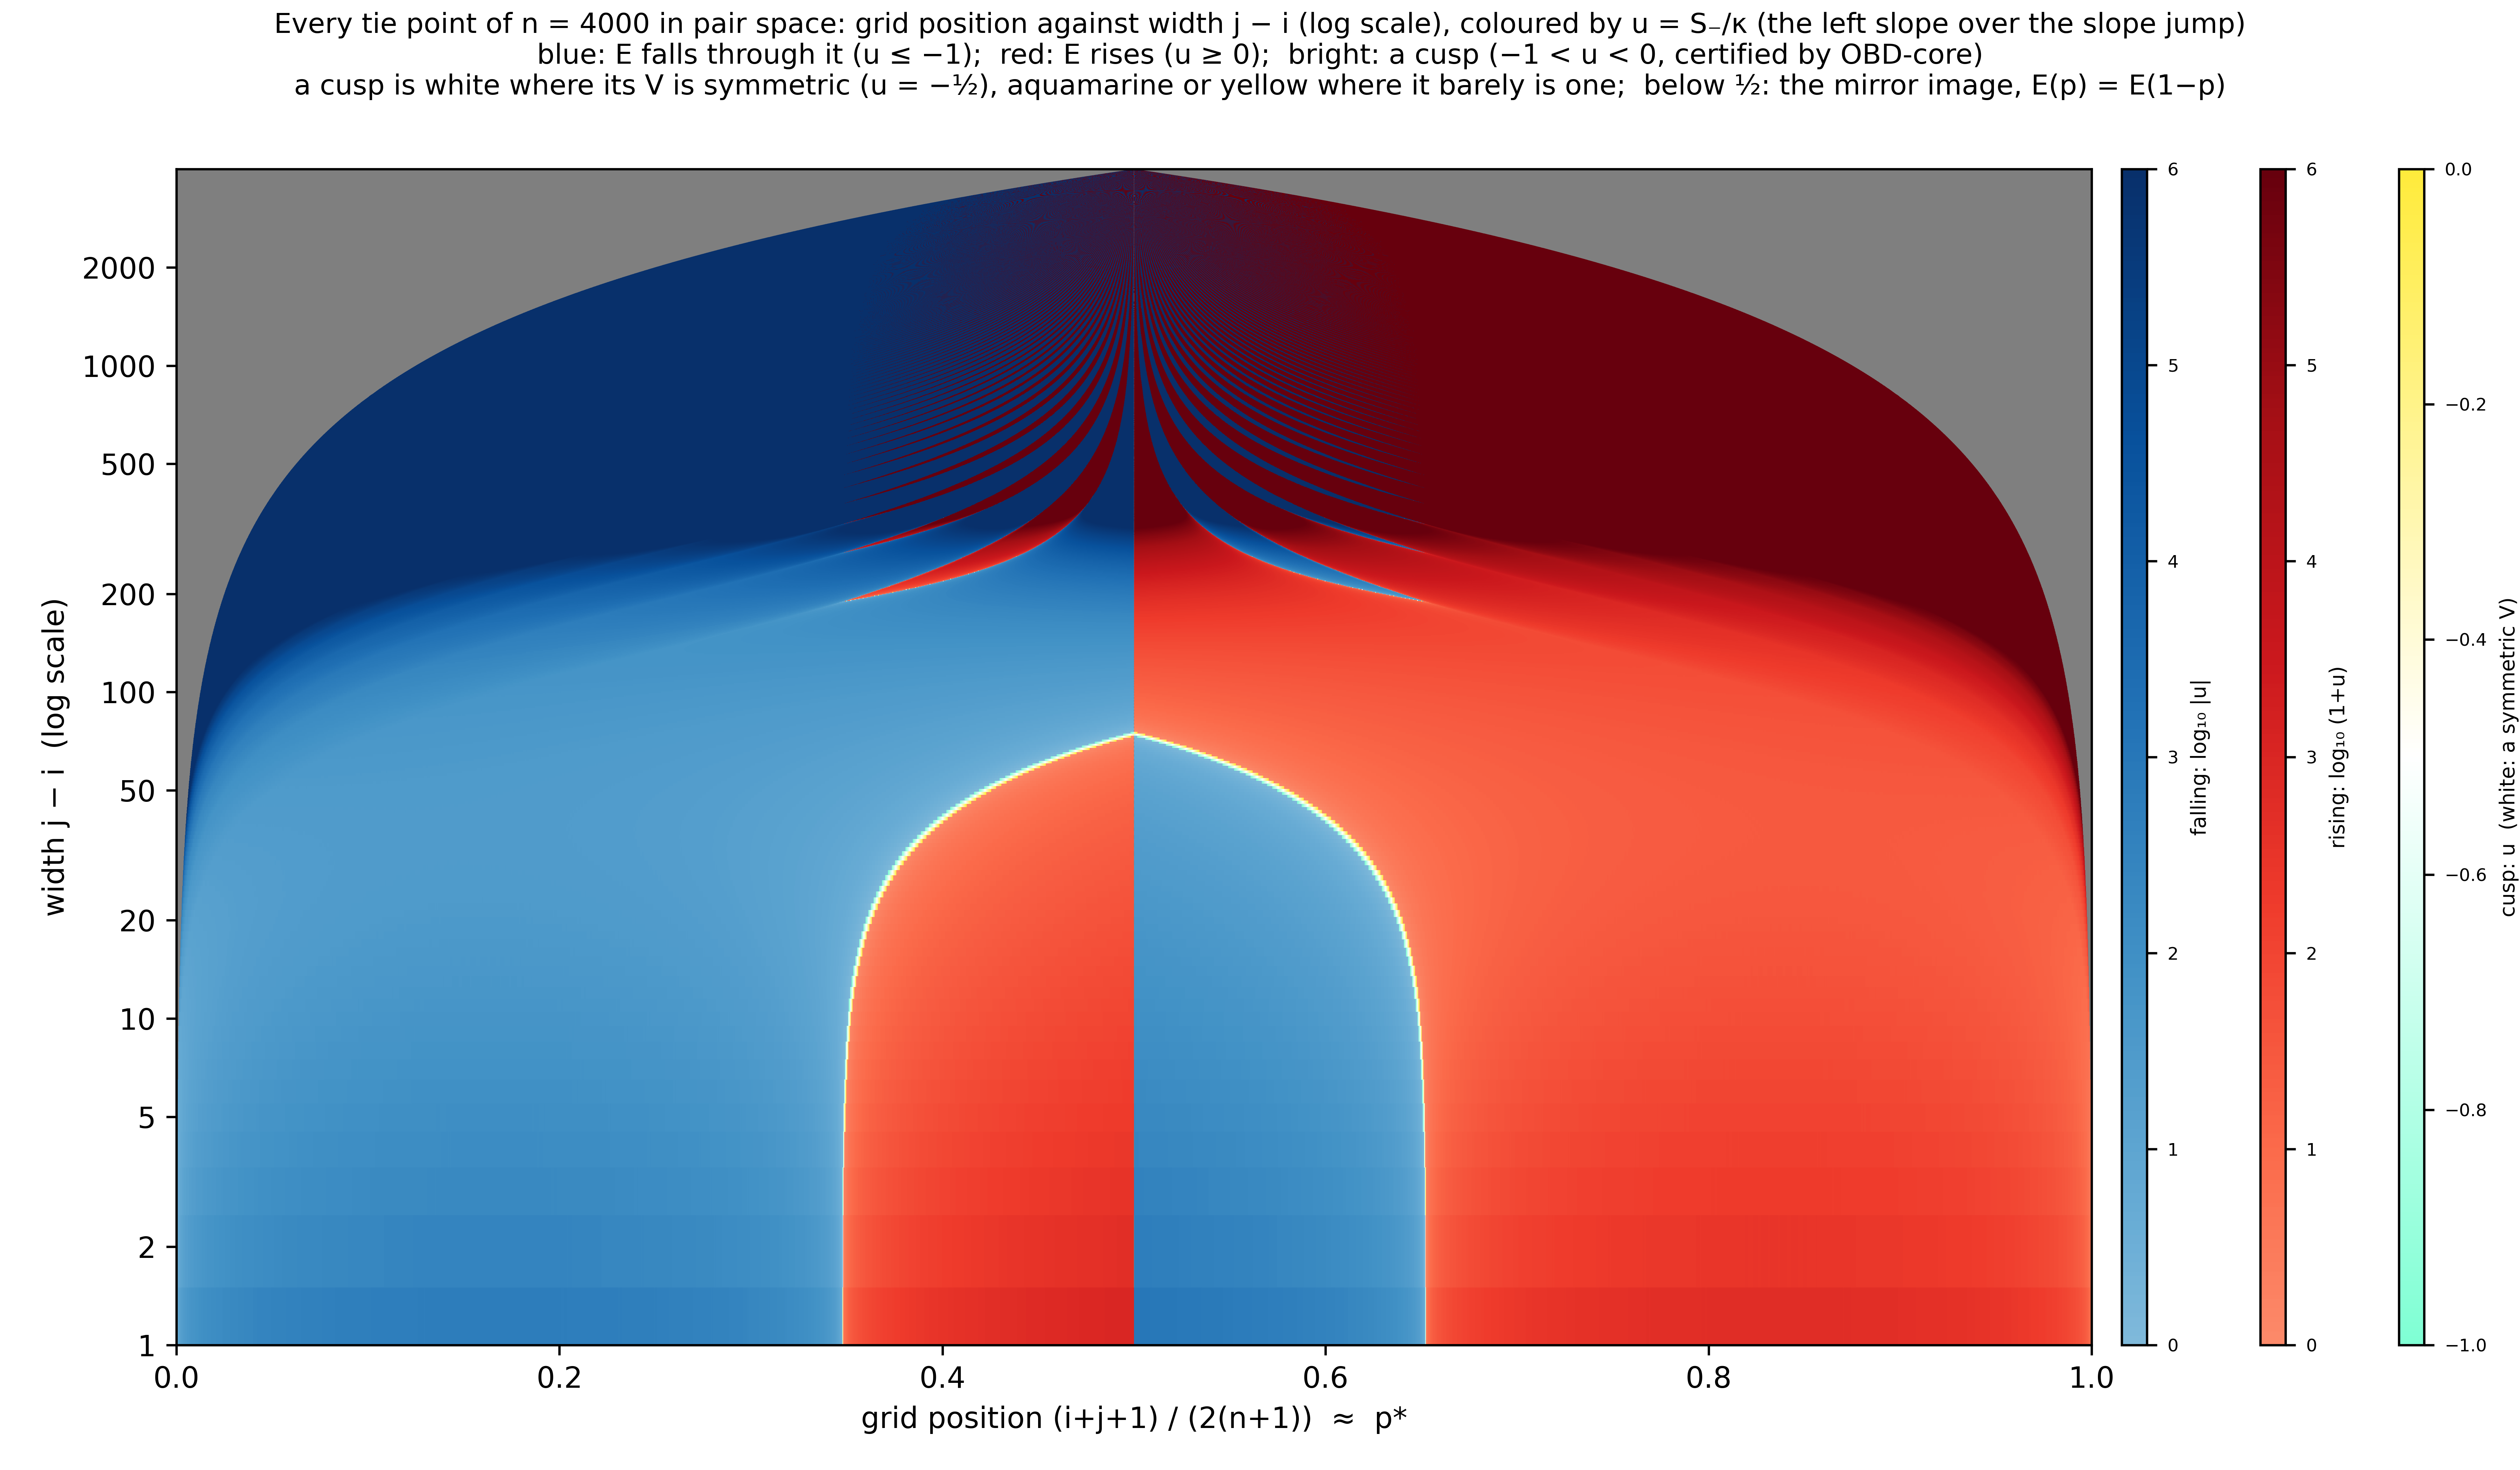
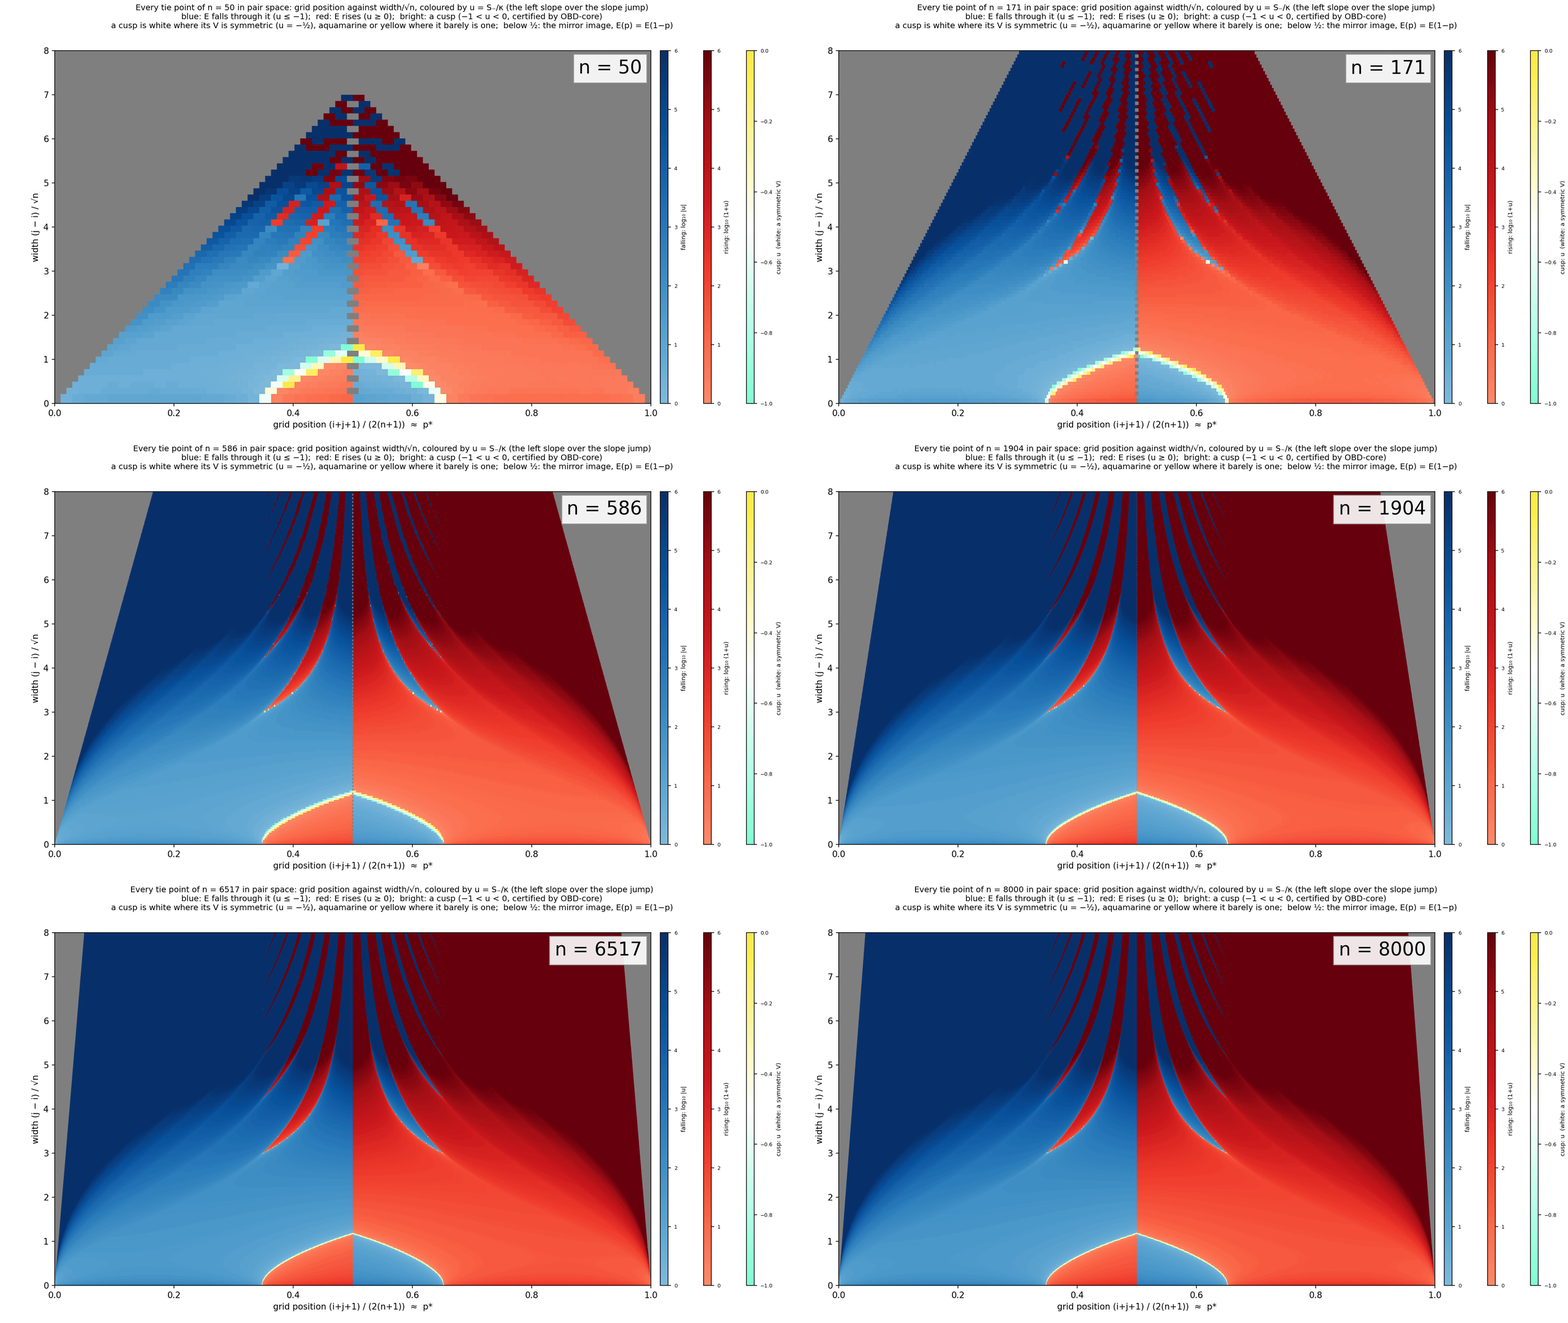
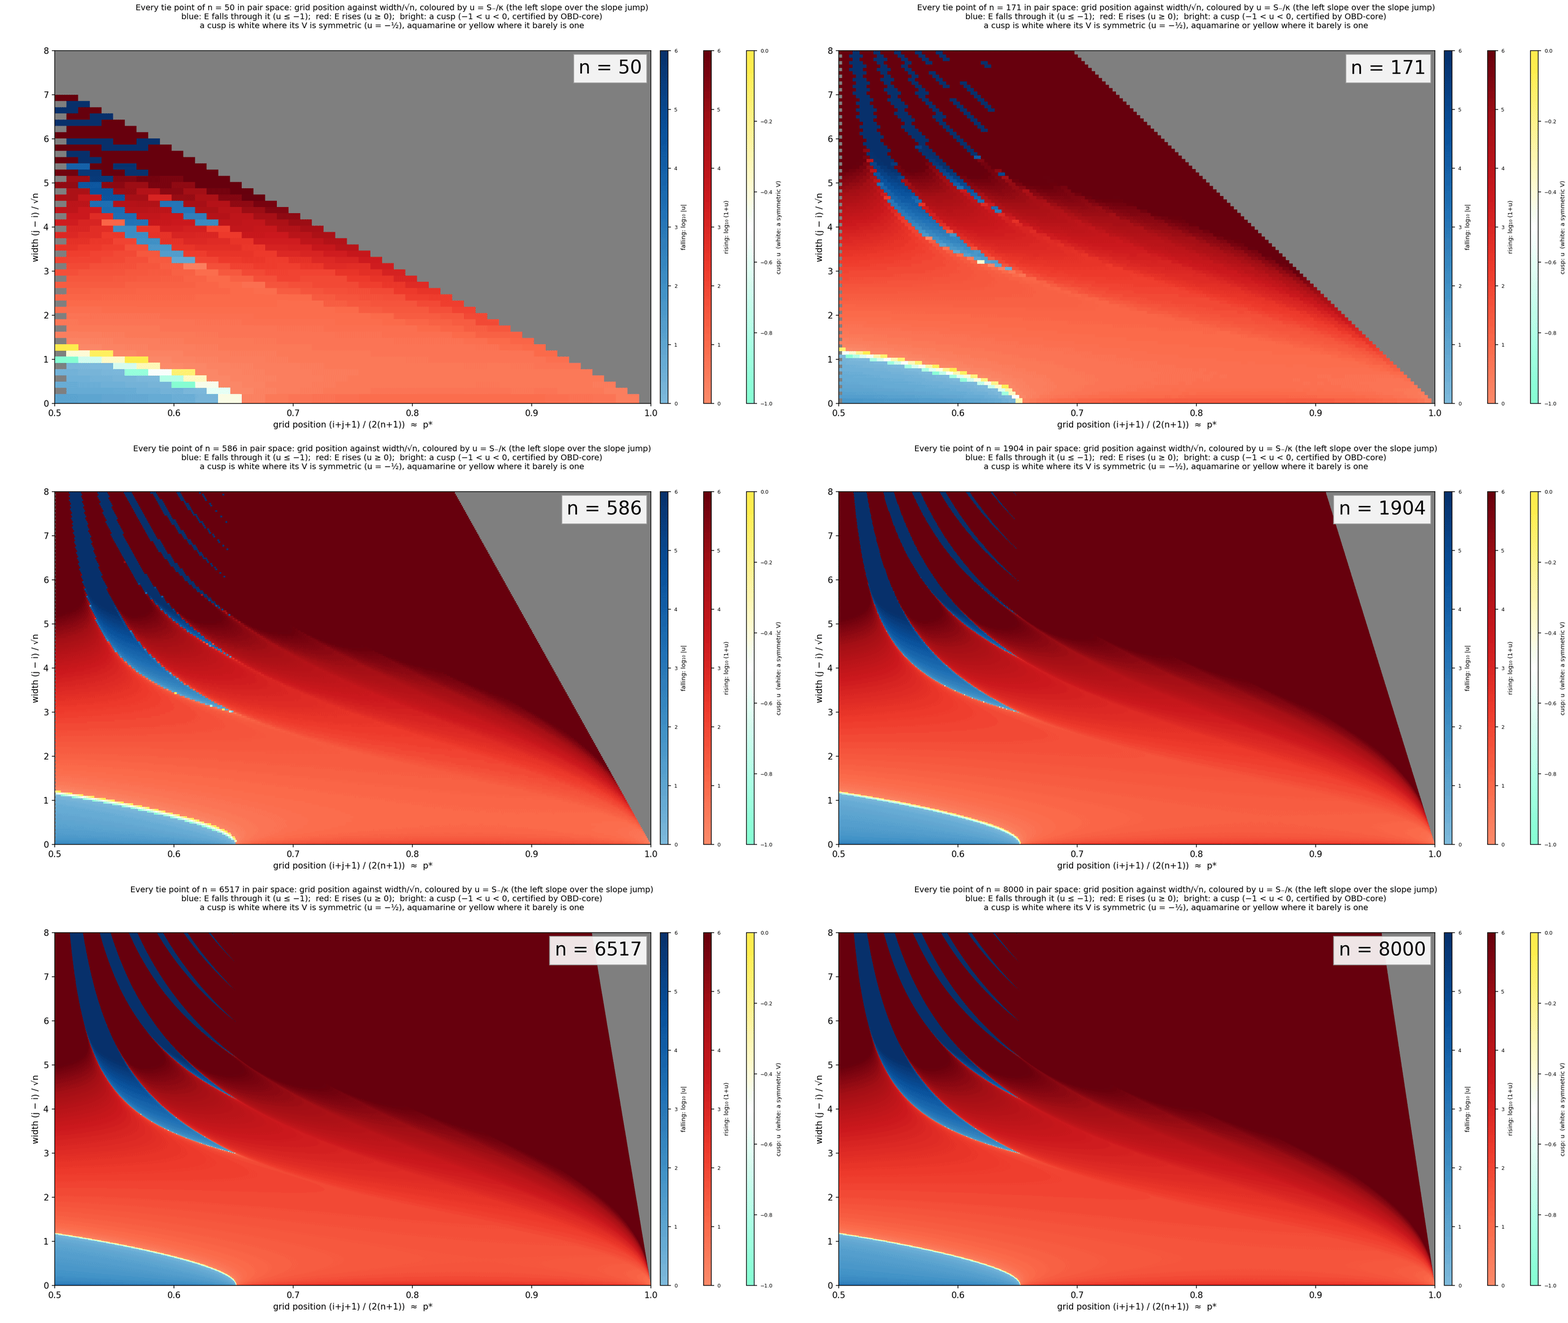
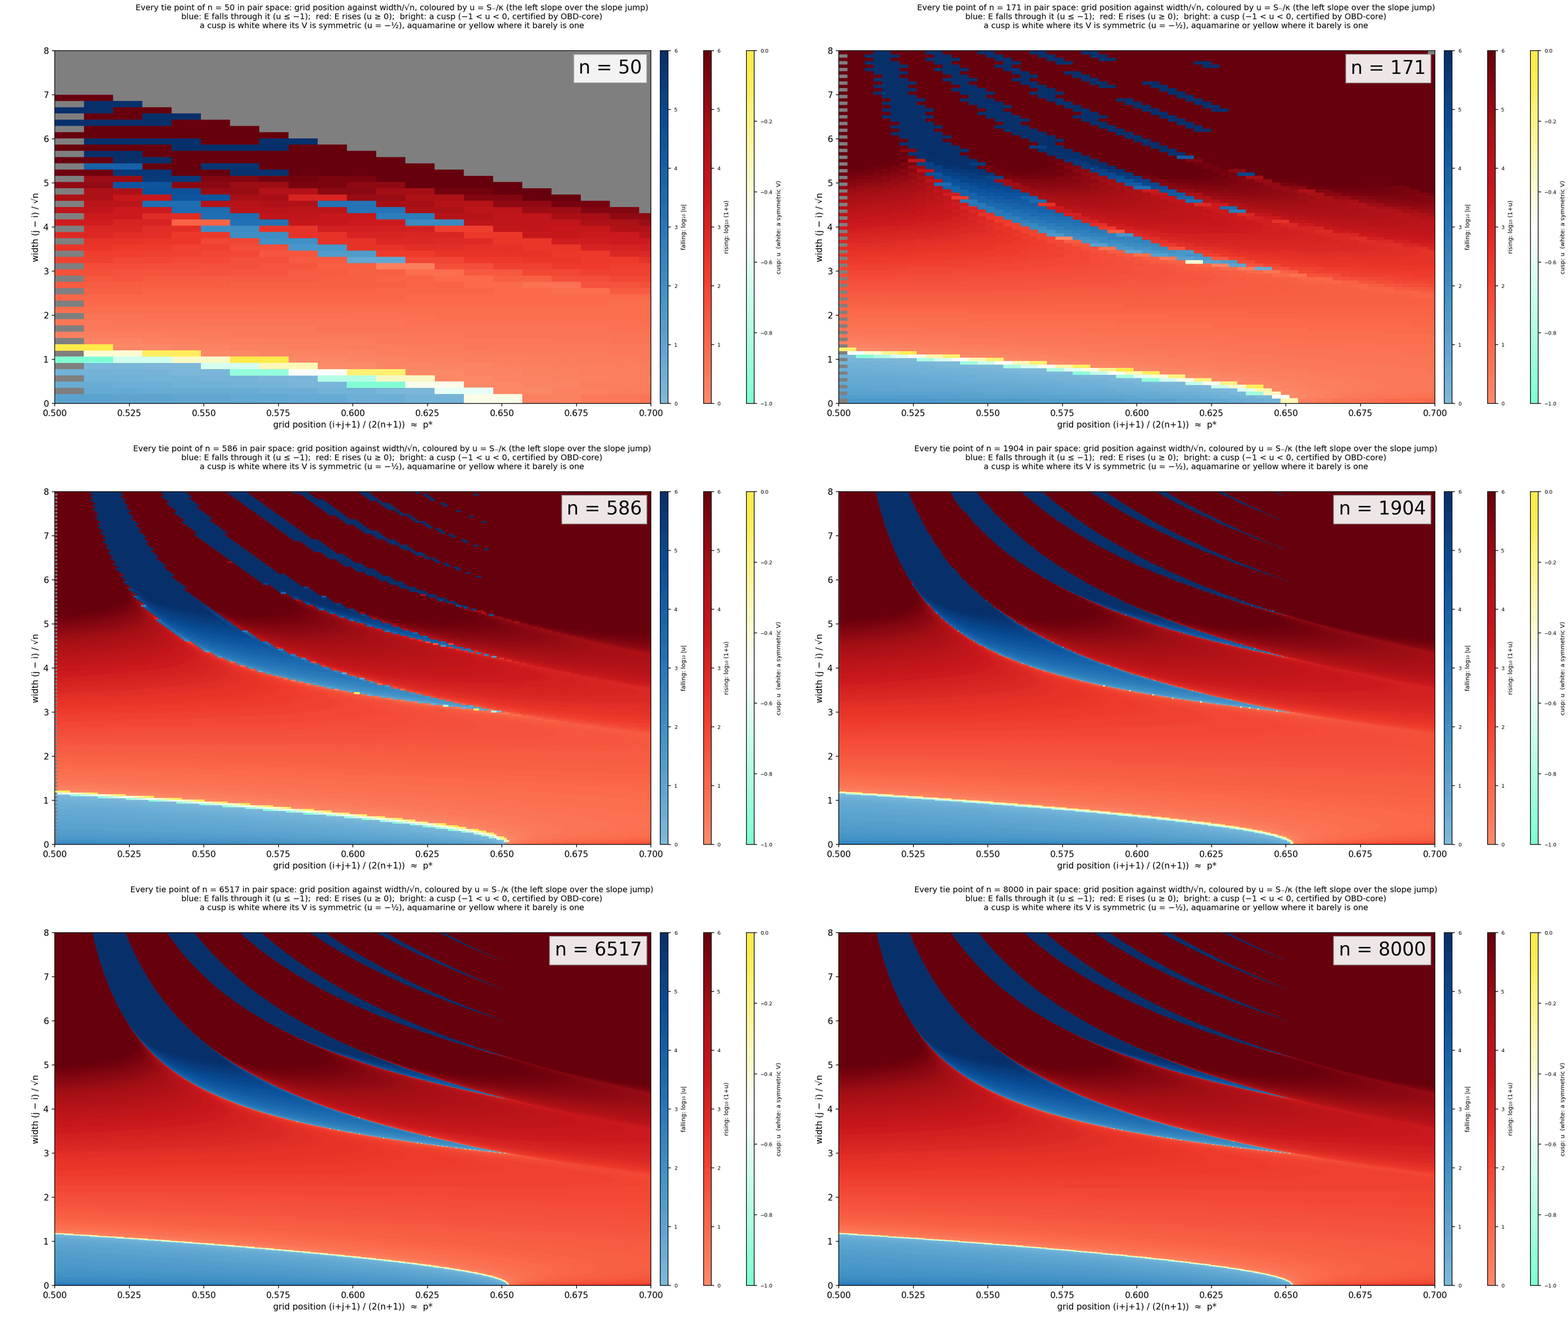
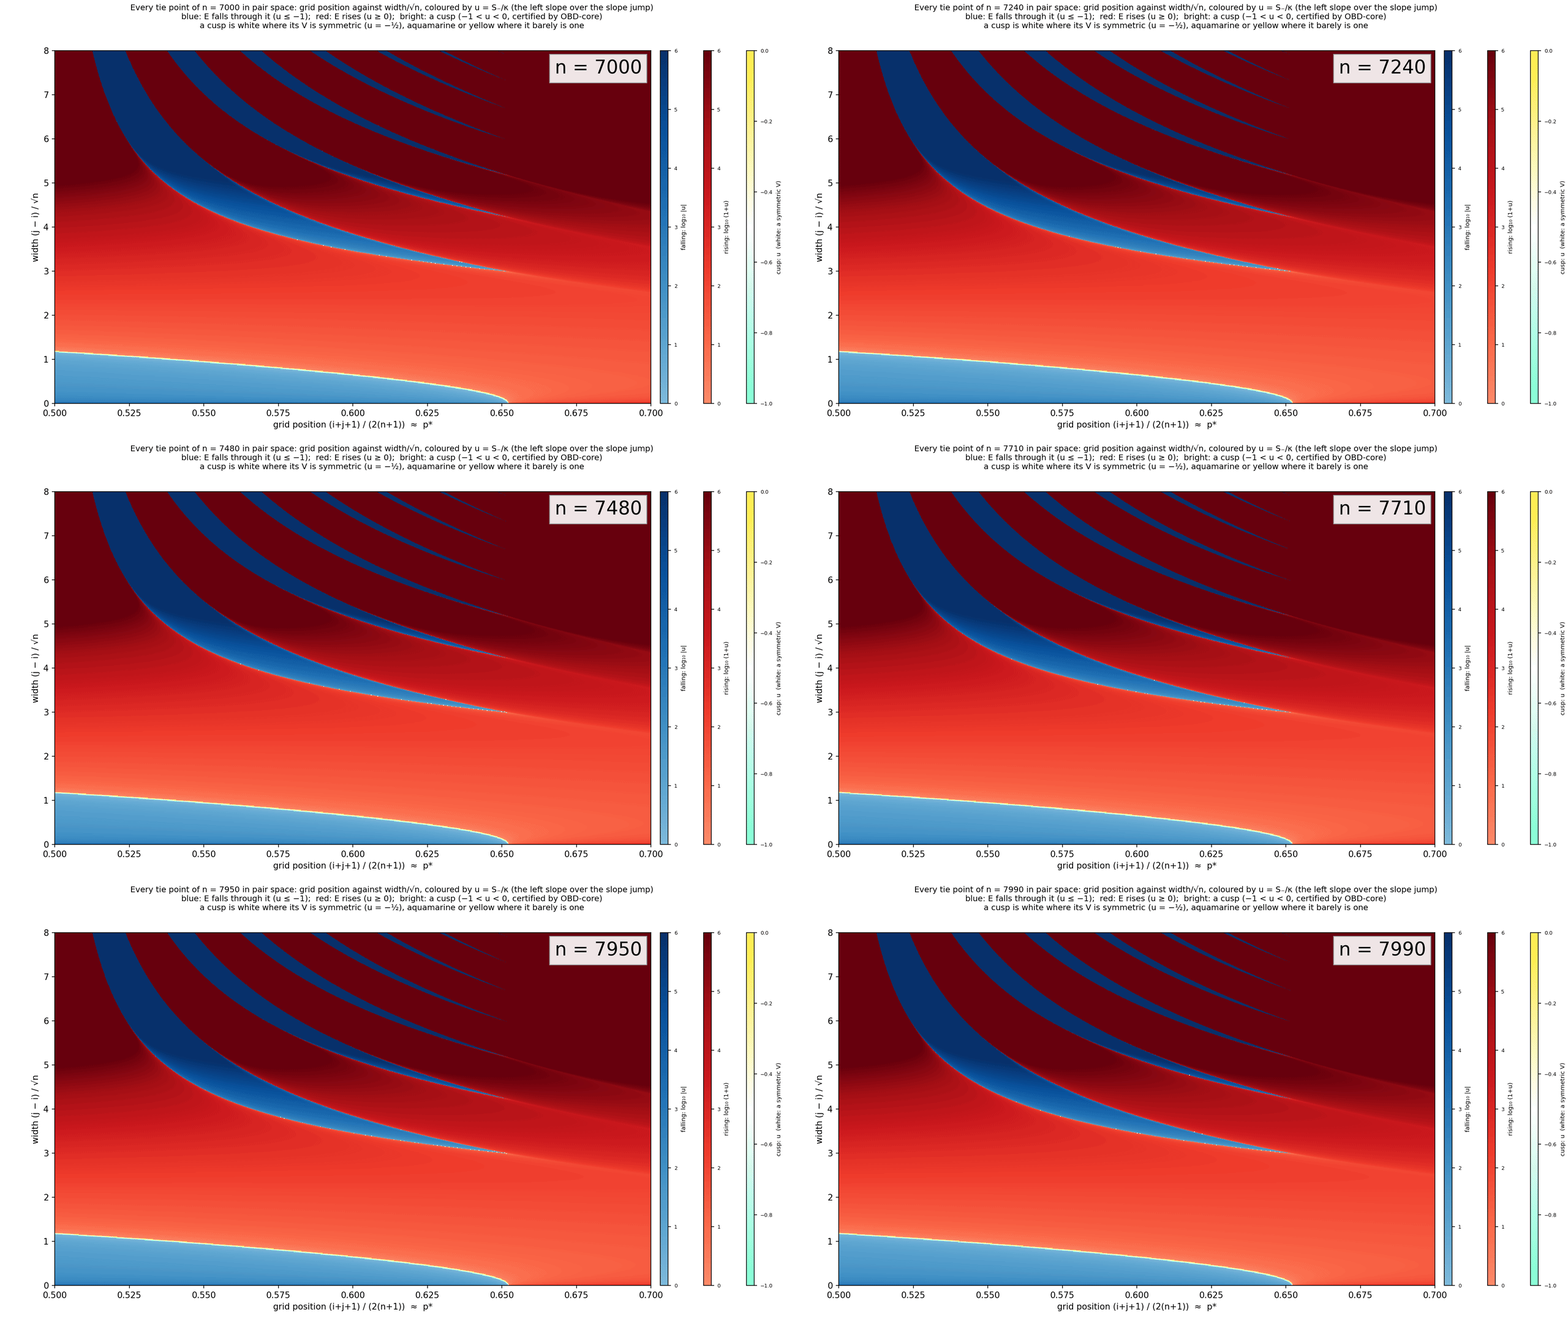
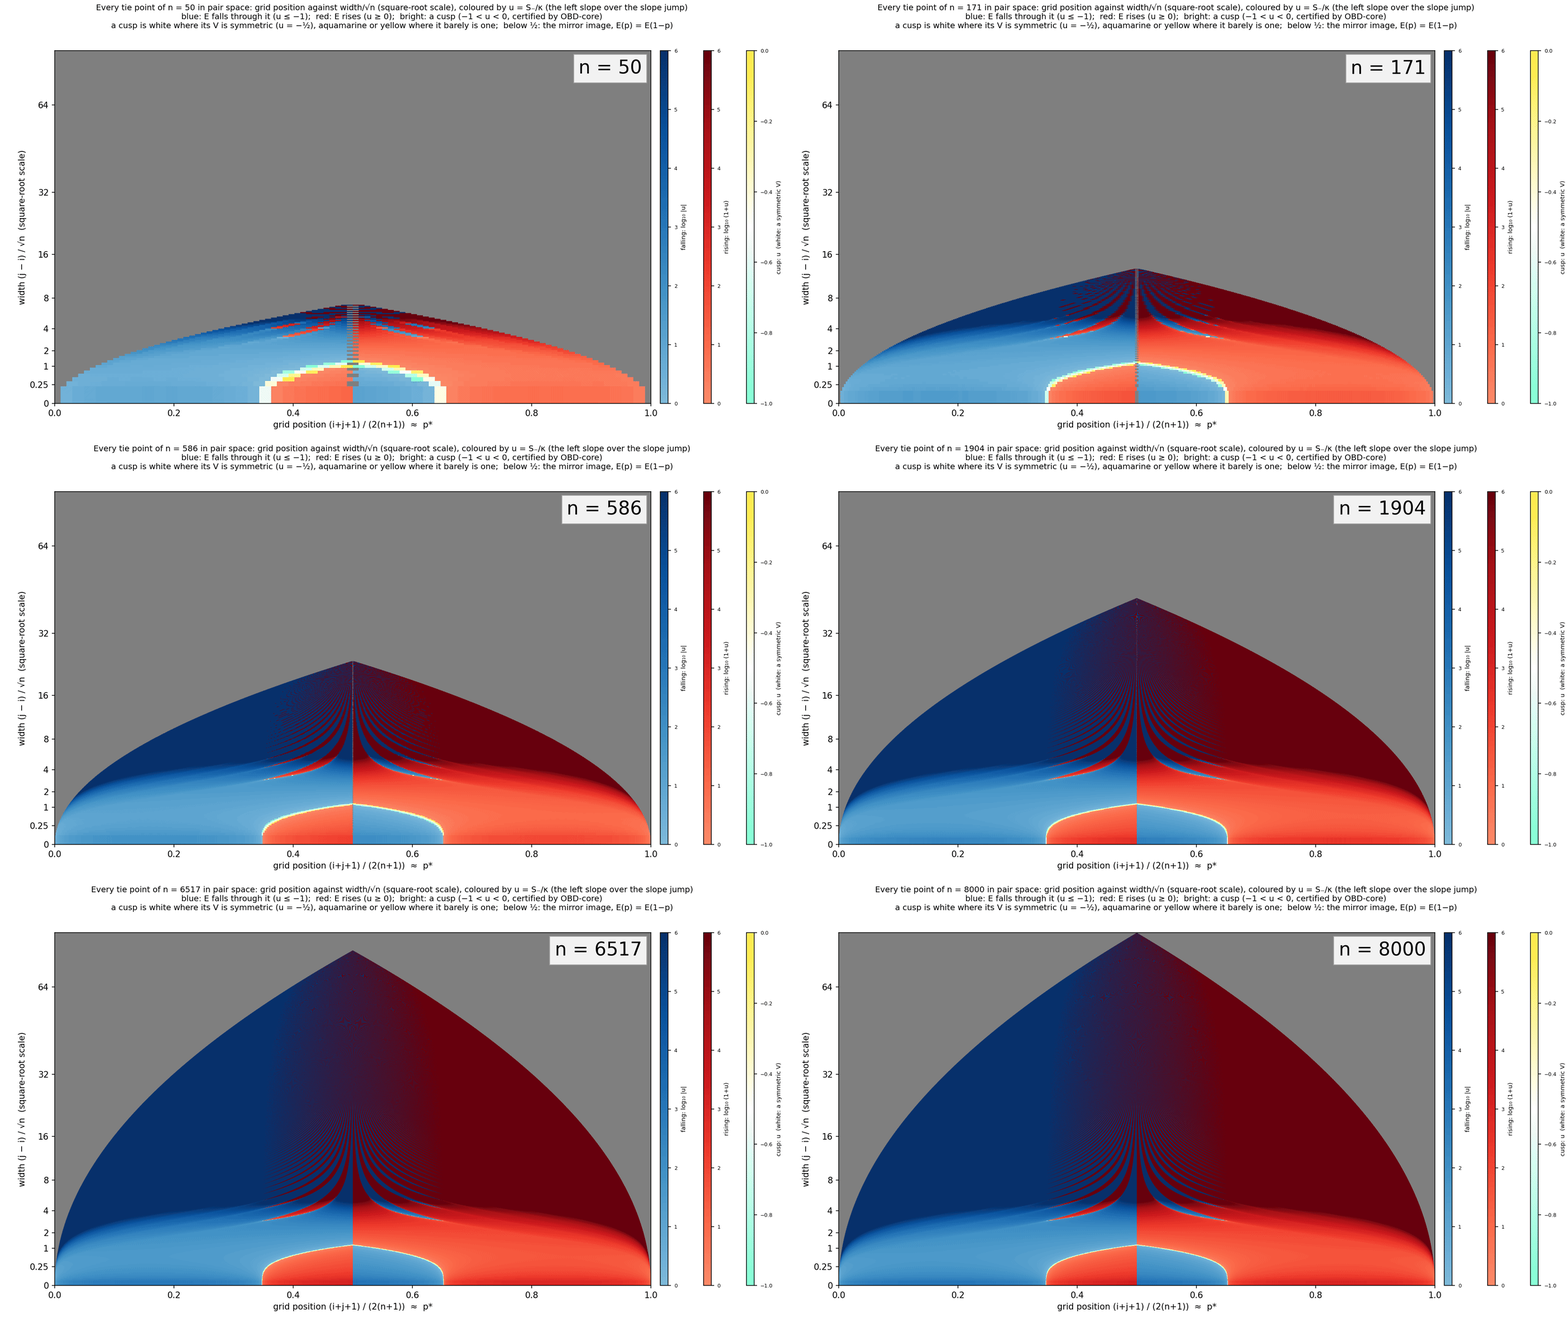
- Pair space, every tie point of one n by position and width, coloured by where the slope changes sign (cusps bright: white for a symmetric V, aquamarine or yellow where it barely is one): n = 100: 0 ≤ p ≤ 1, ½ ≤ p ≤ 1, ½ ≤ p ≤ 0.7; n = 1000: 0 ≤ p ≤ 1, ½ ≤ p ≤ 1, ½ ≤ p ≤ 0.7; n = 4000: 0 ≤ p ≤ 1, ½ ≤ p ≤ 1, ½ ≤ p ≤ 0.7; the whole triangle with the width stretched near zero, where the cusps are: square-root scale, log scale.
As n grows from 50 to 8000, animated: 0 ≤ p ≤ 1 (MP4, GIF), ½ ≤ p ≤ 1 (MP4, GIF), ½ ≤ p ≤ 0.7 (MP4, GIF; and every 10th n from 7000 to 8000: MP4, GIF); the whole triangle on a square-root width scale, 0 ≤ p ≤ 1 (MP4, GIF):
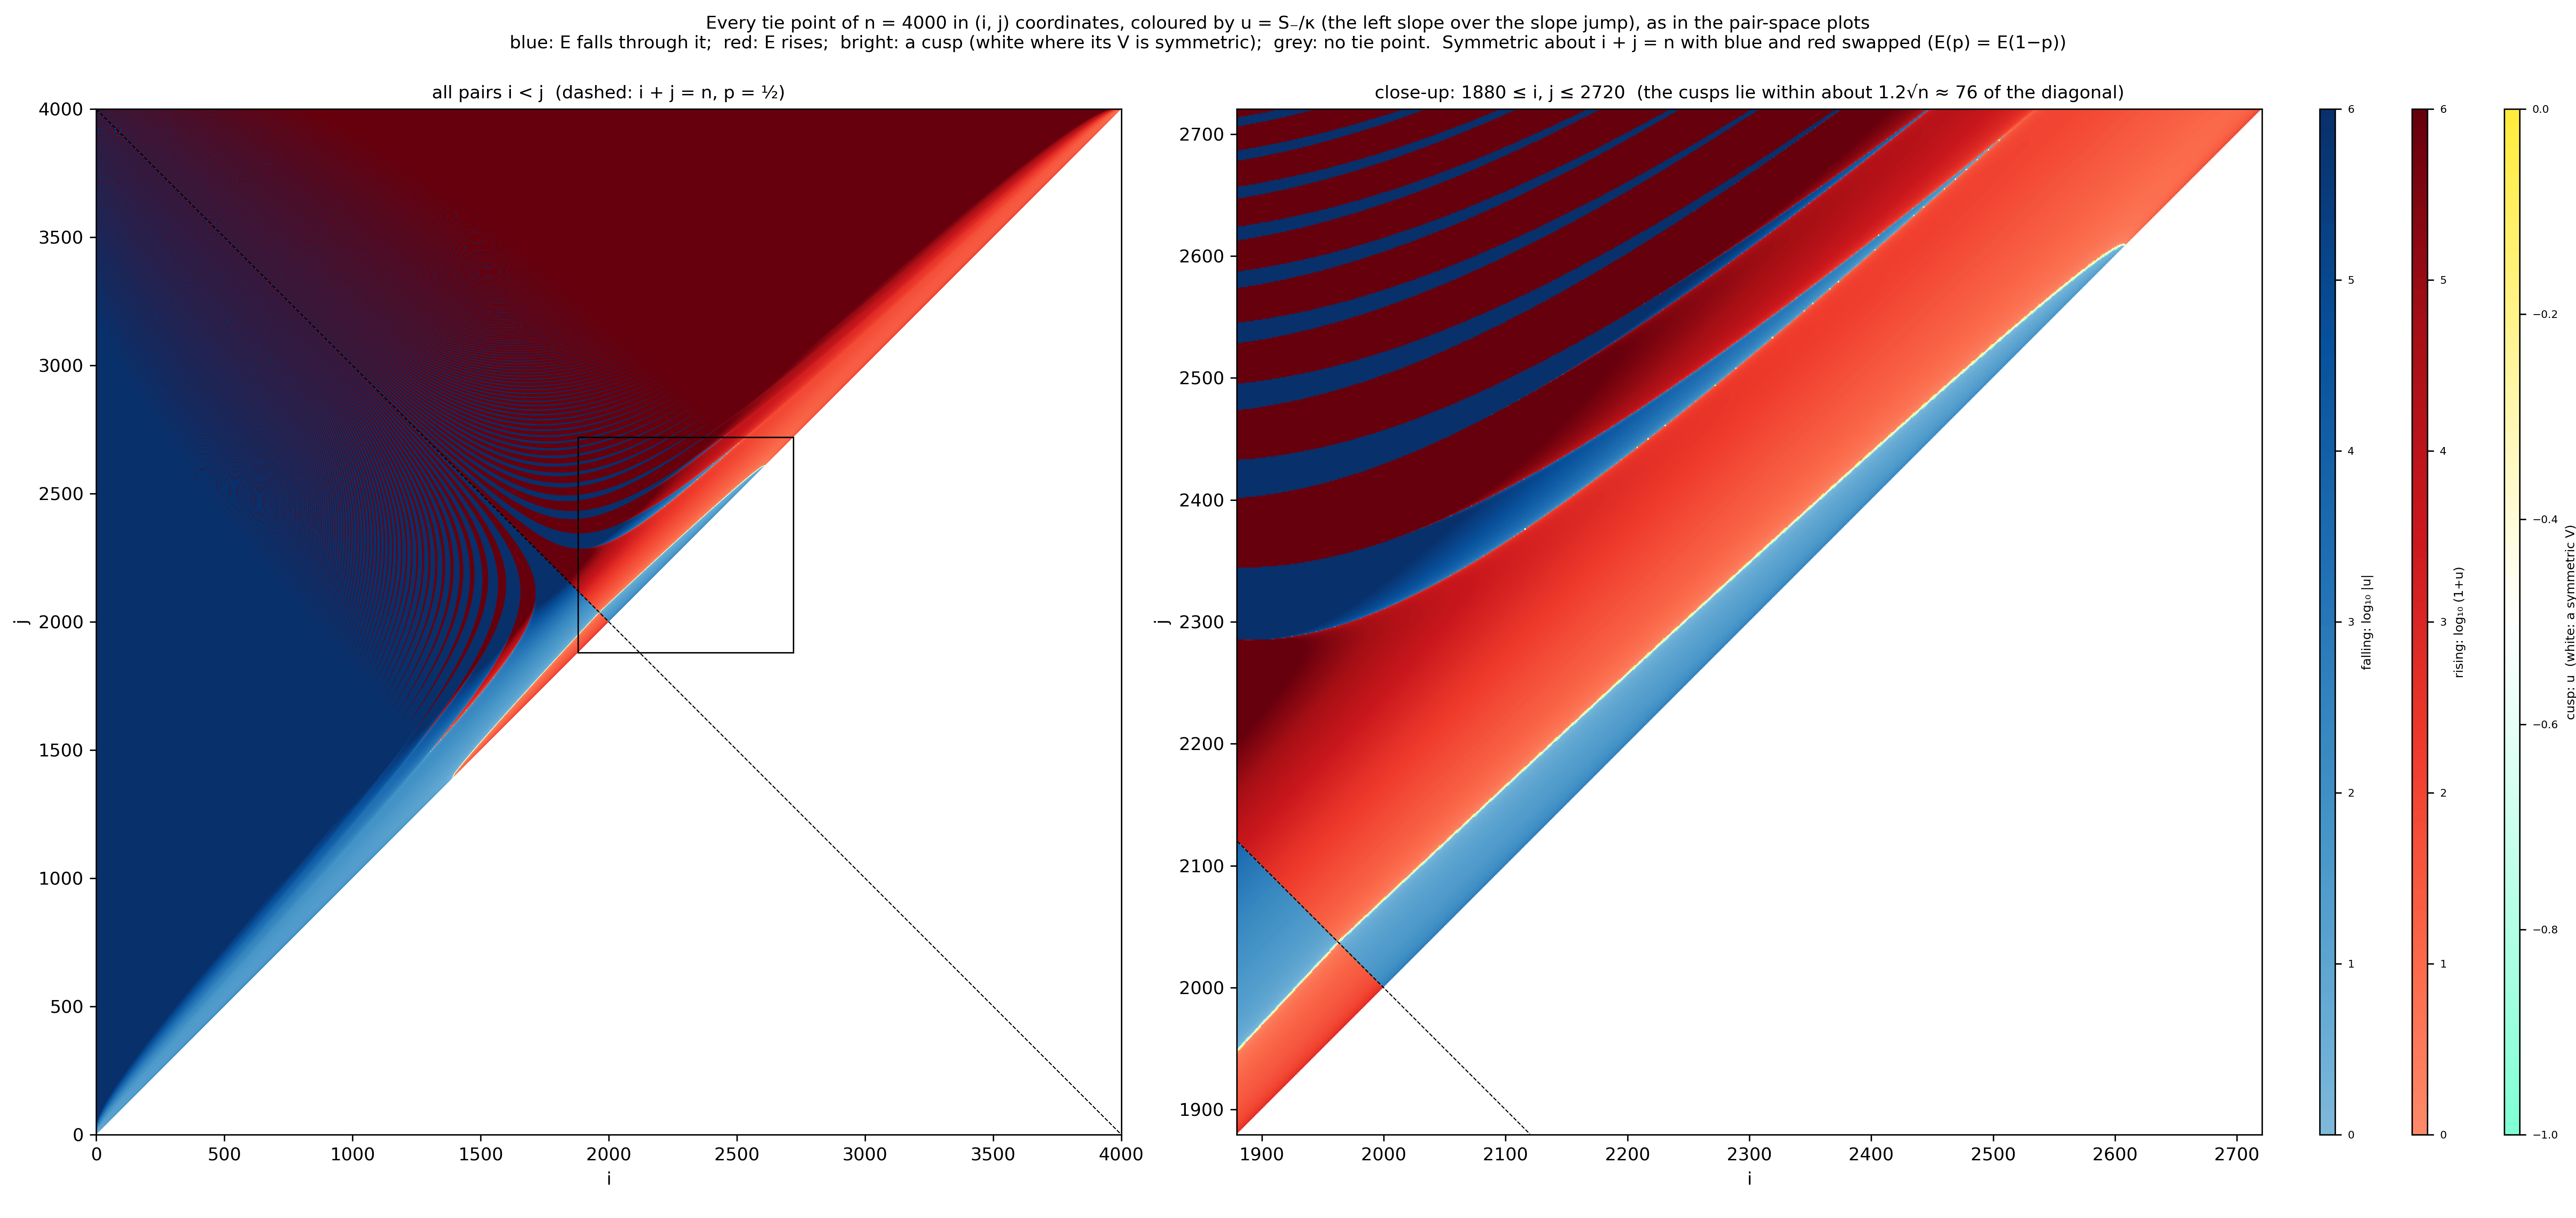
- The same tie points in (i, j) coordinates, n = 4000: every pair out to width n, with a close-up of the diagonal where the cusps are
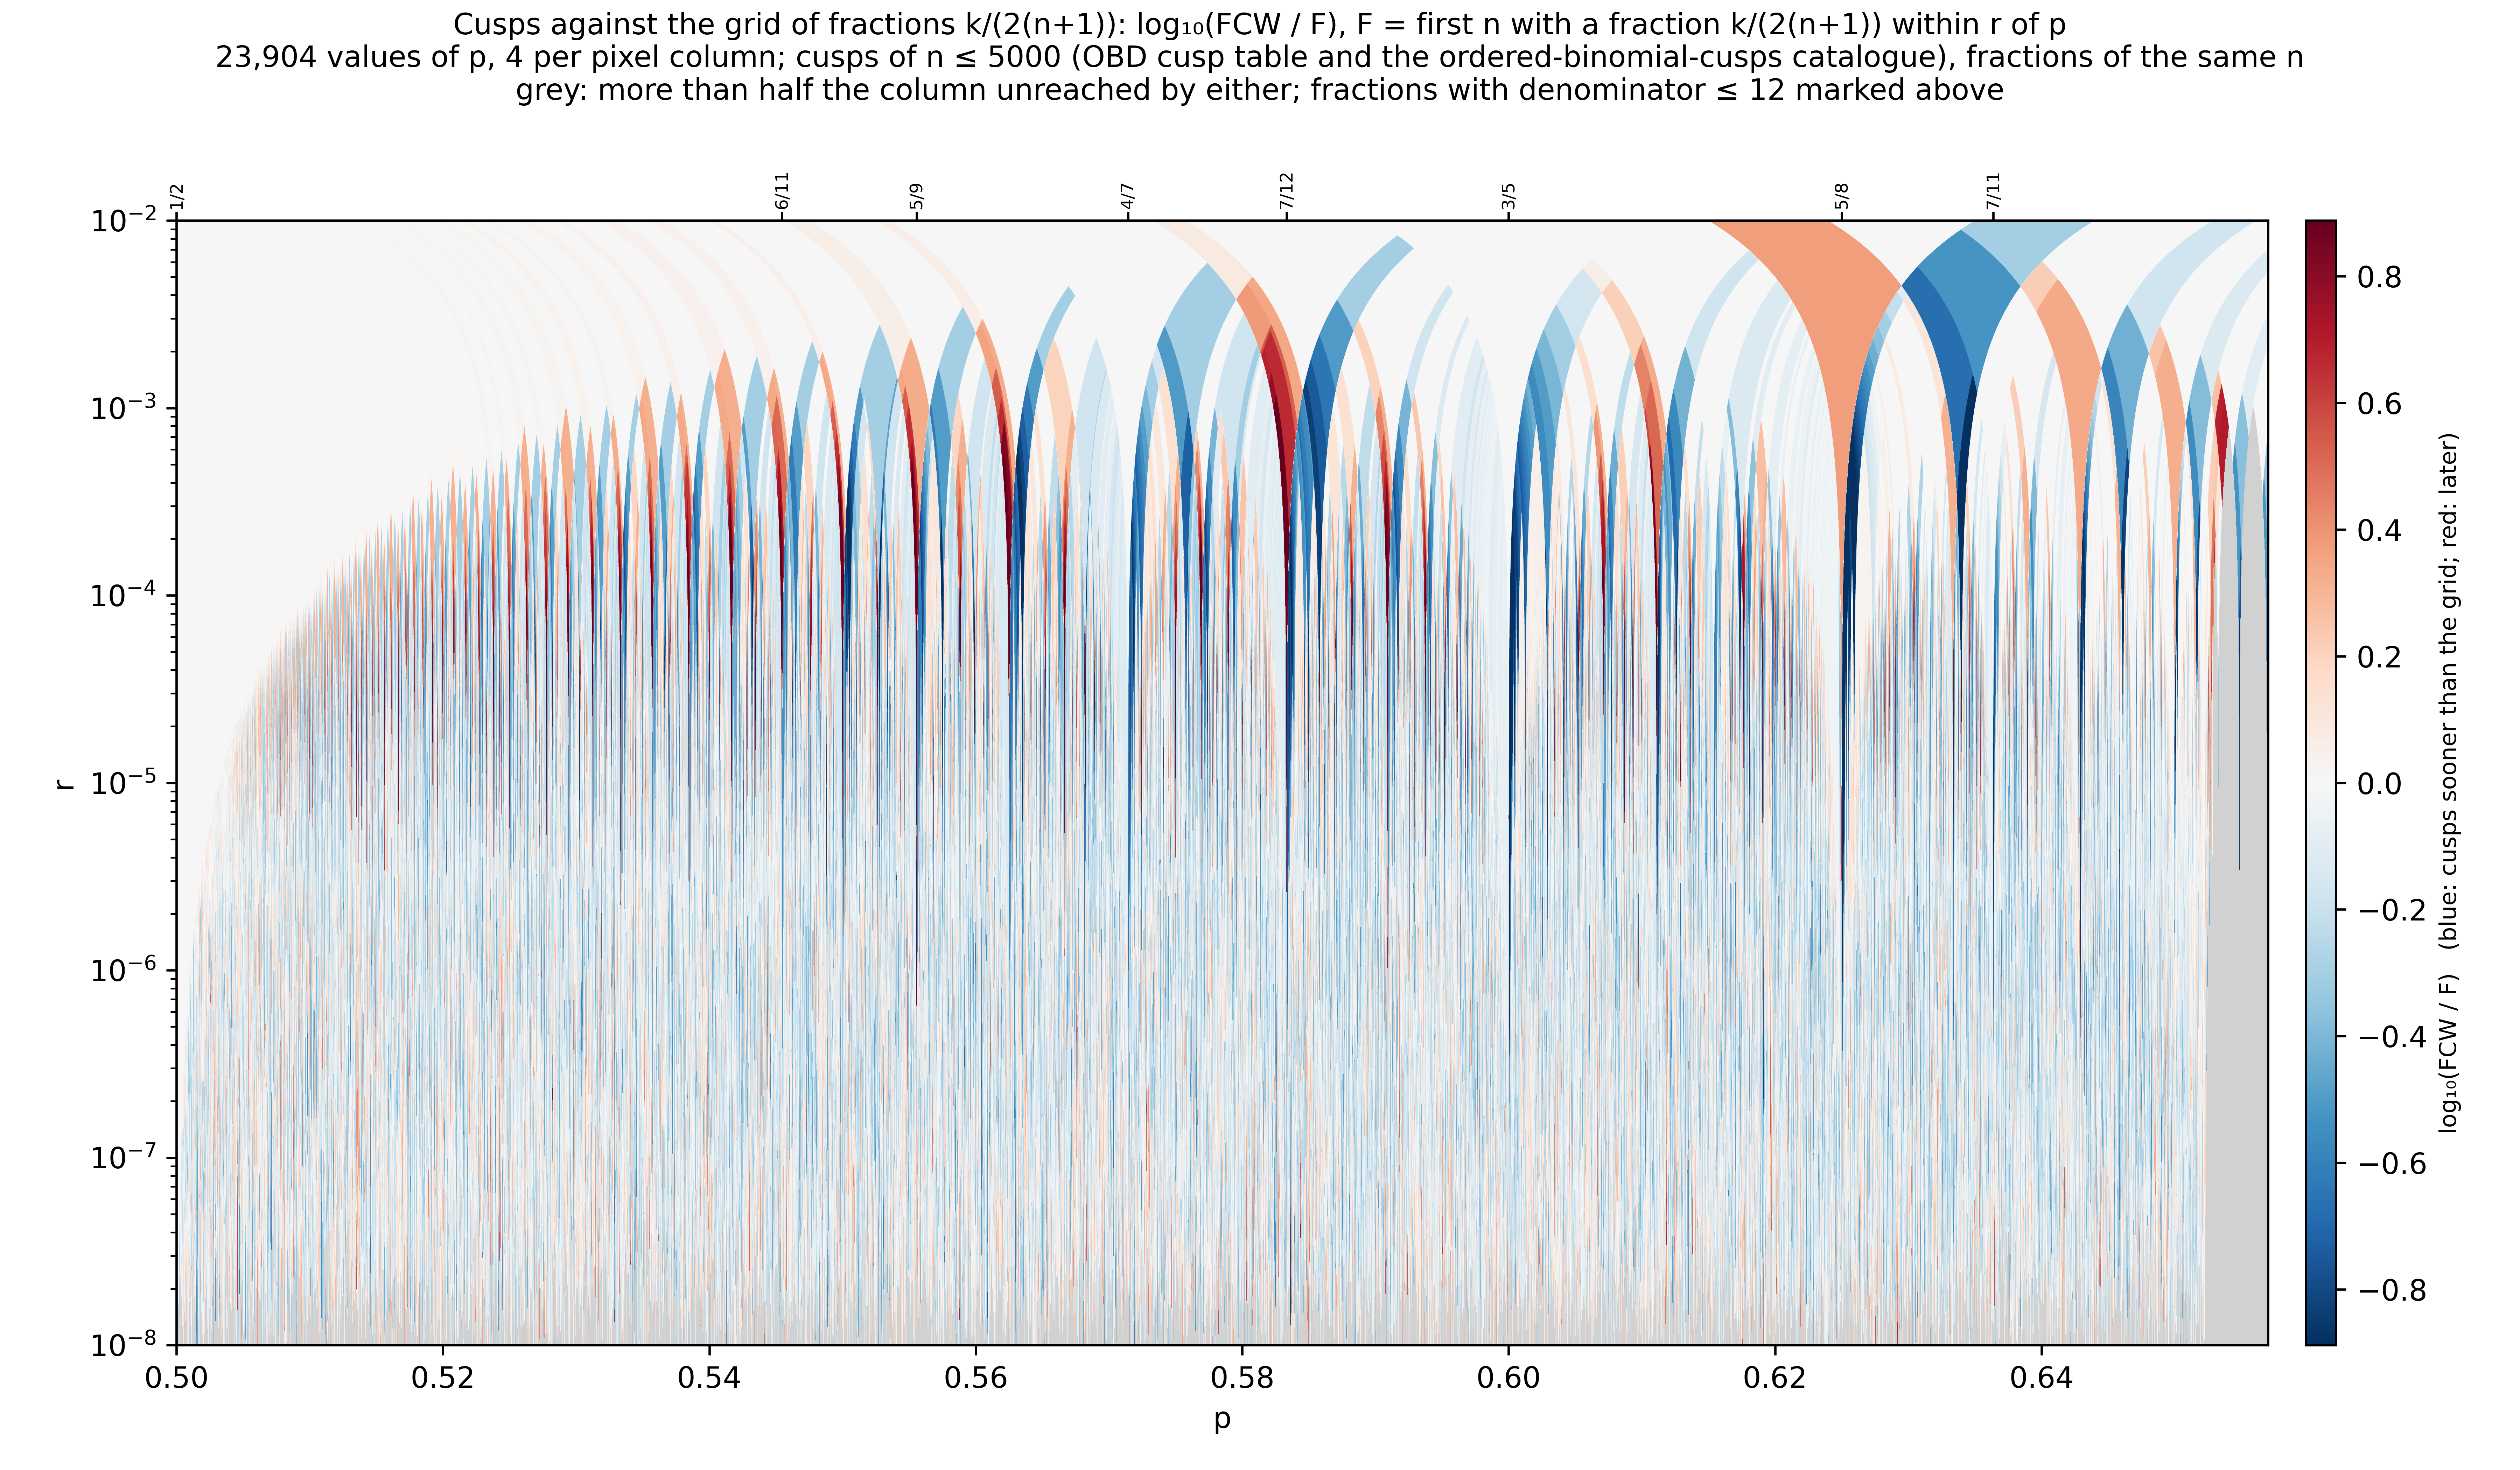
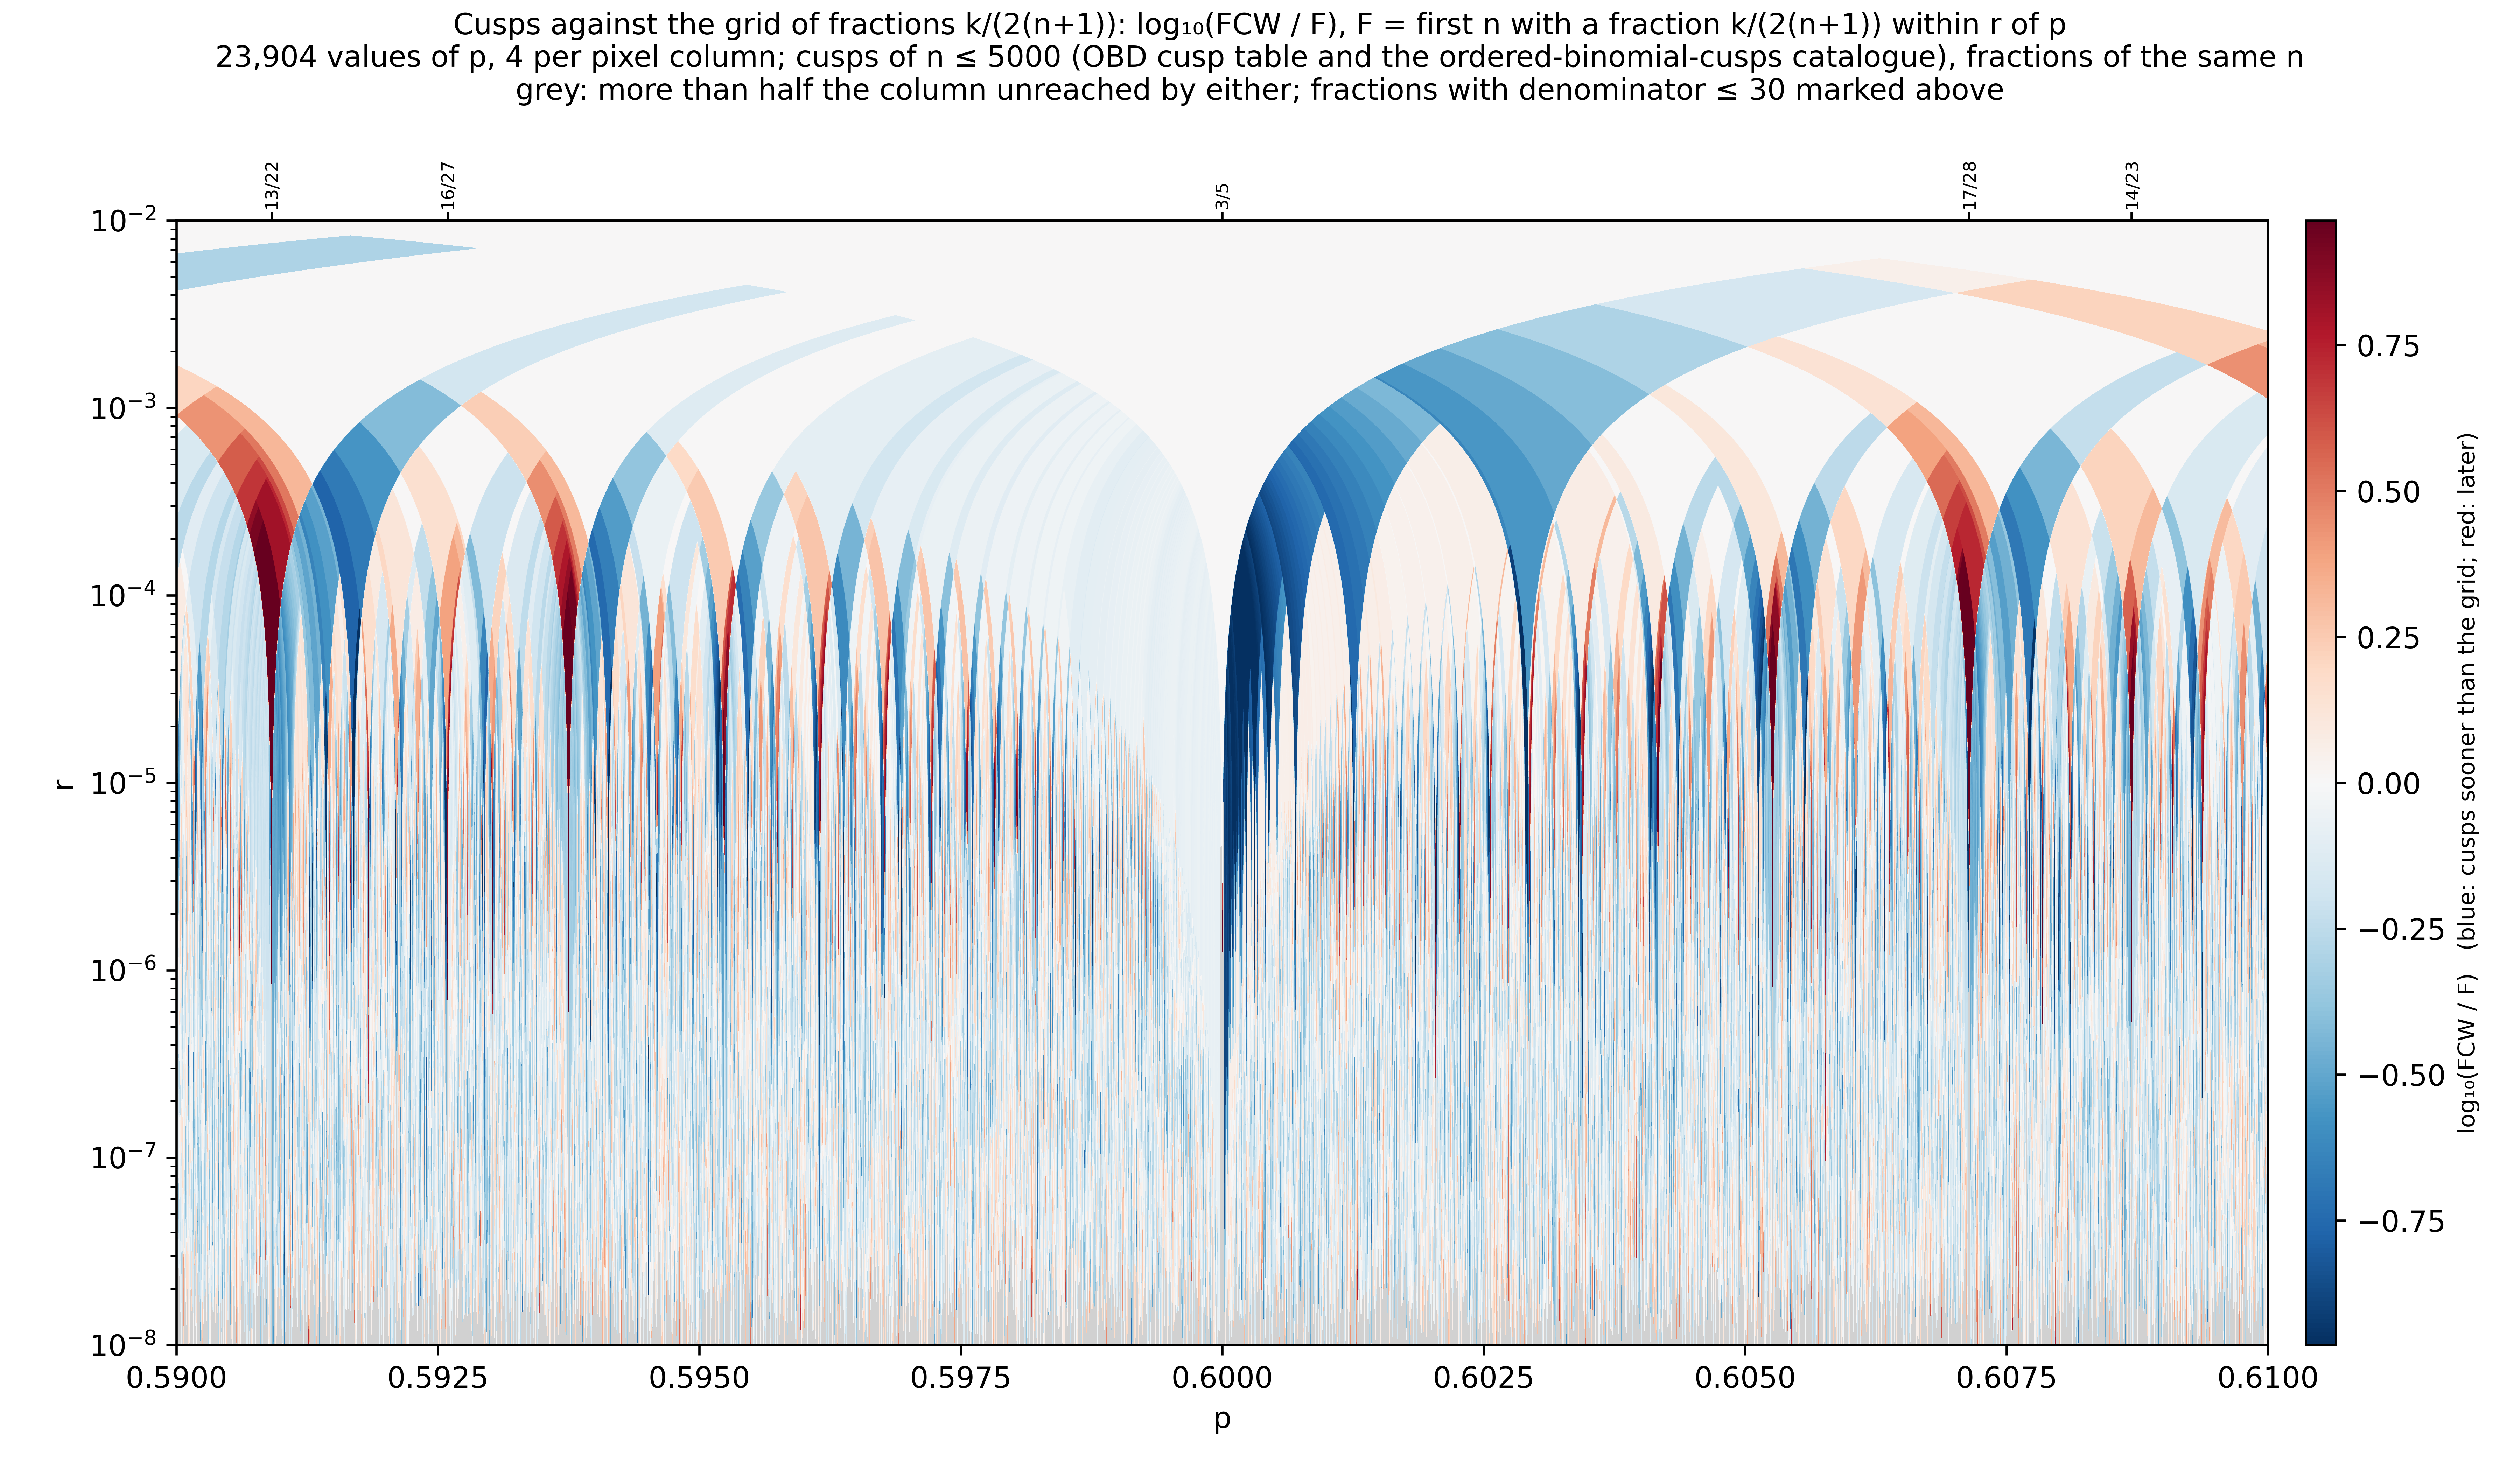
- Cusps against the bare grid of fractions k/(2(n+1)), log₁₀(FCW/F): full band, 0.59 ≤ p ≤ 0.61
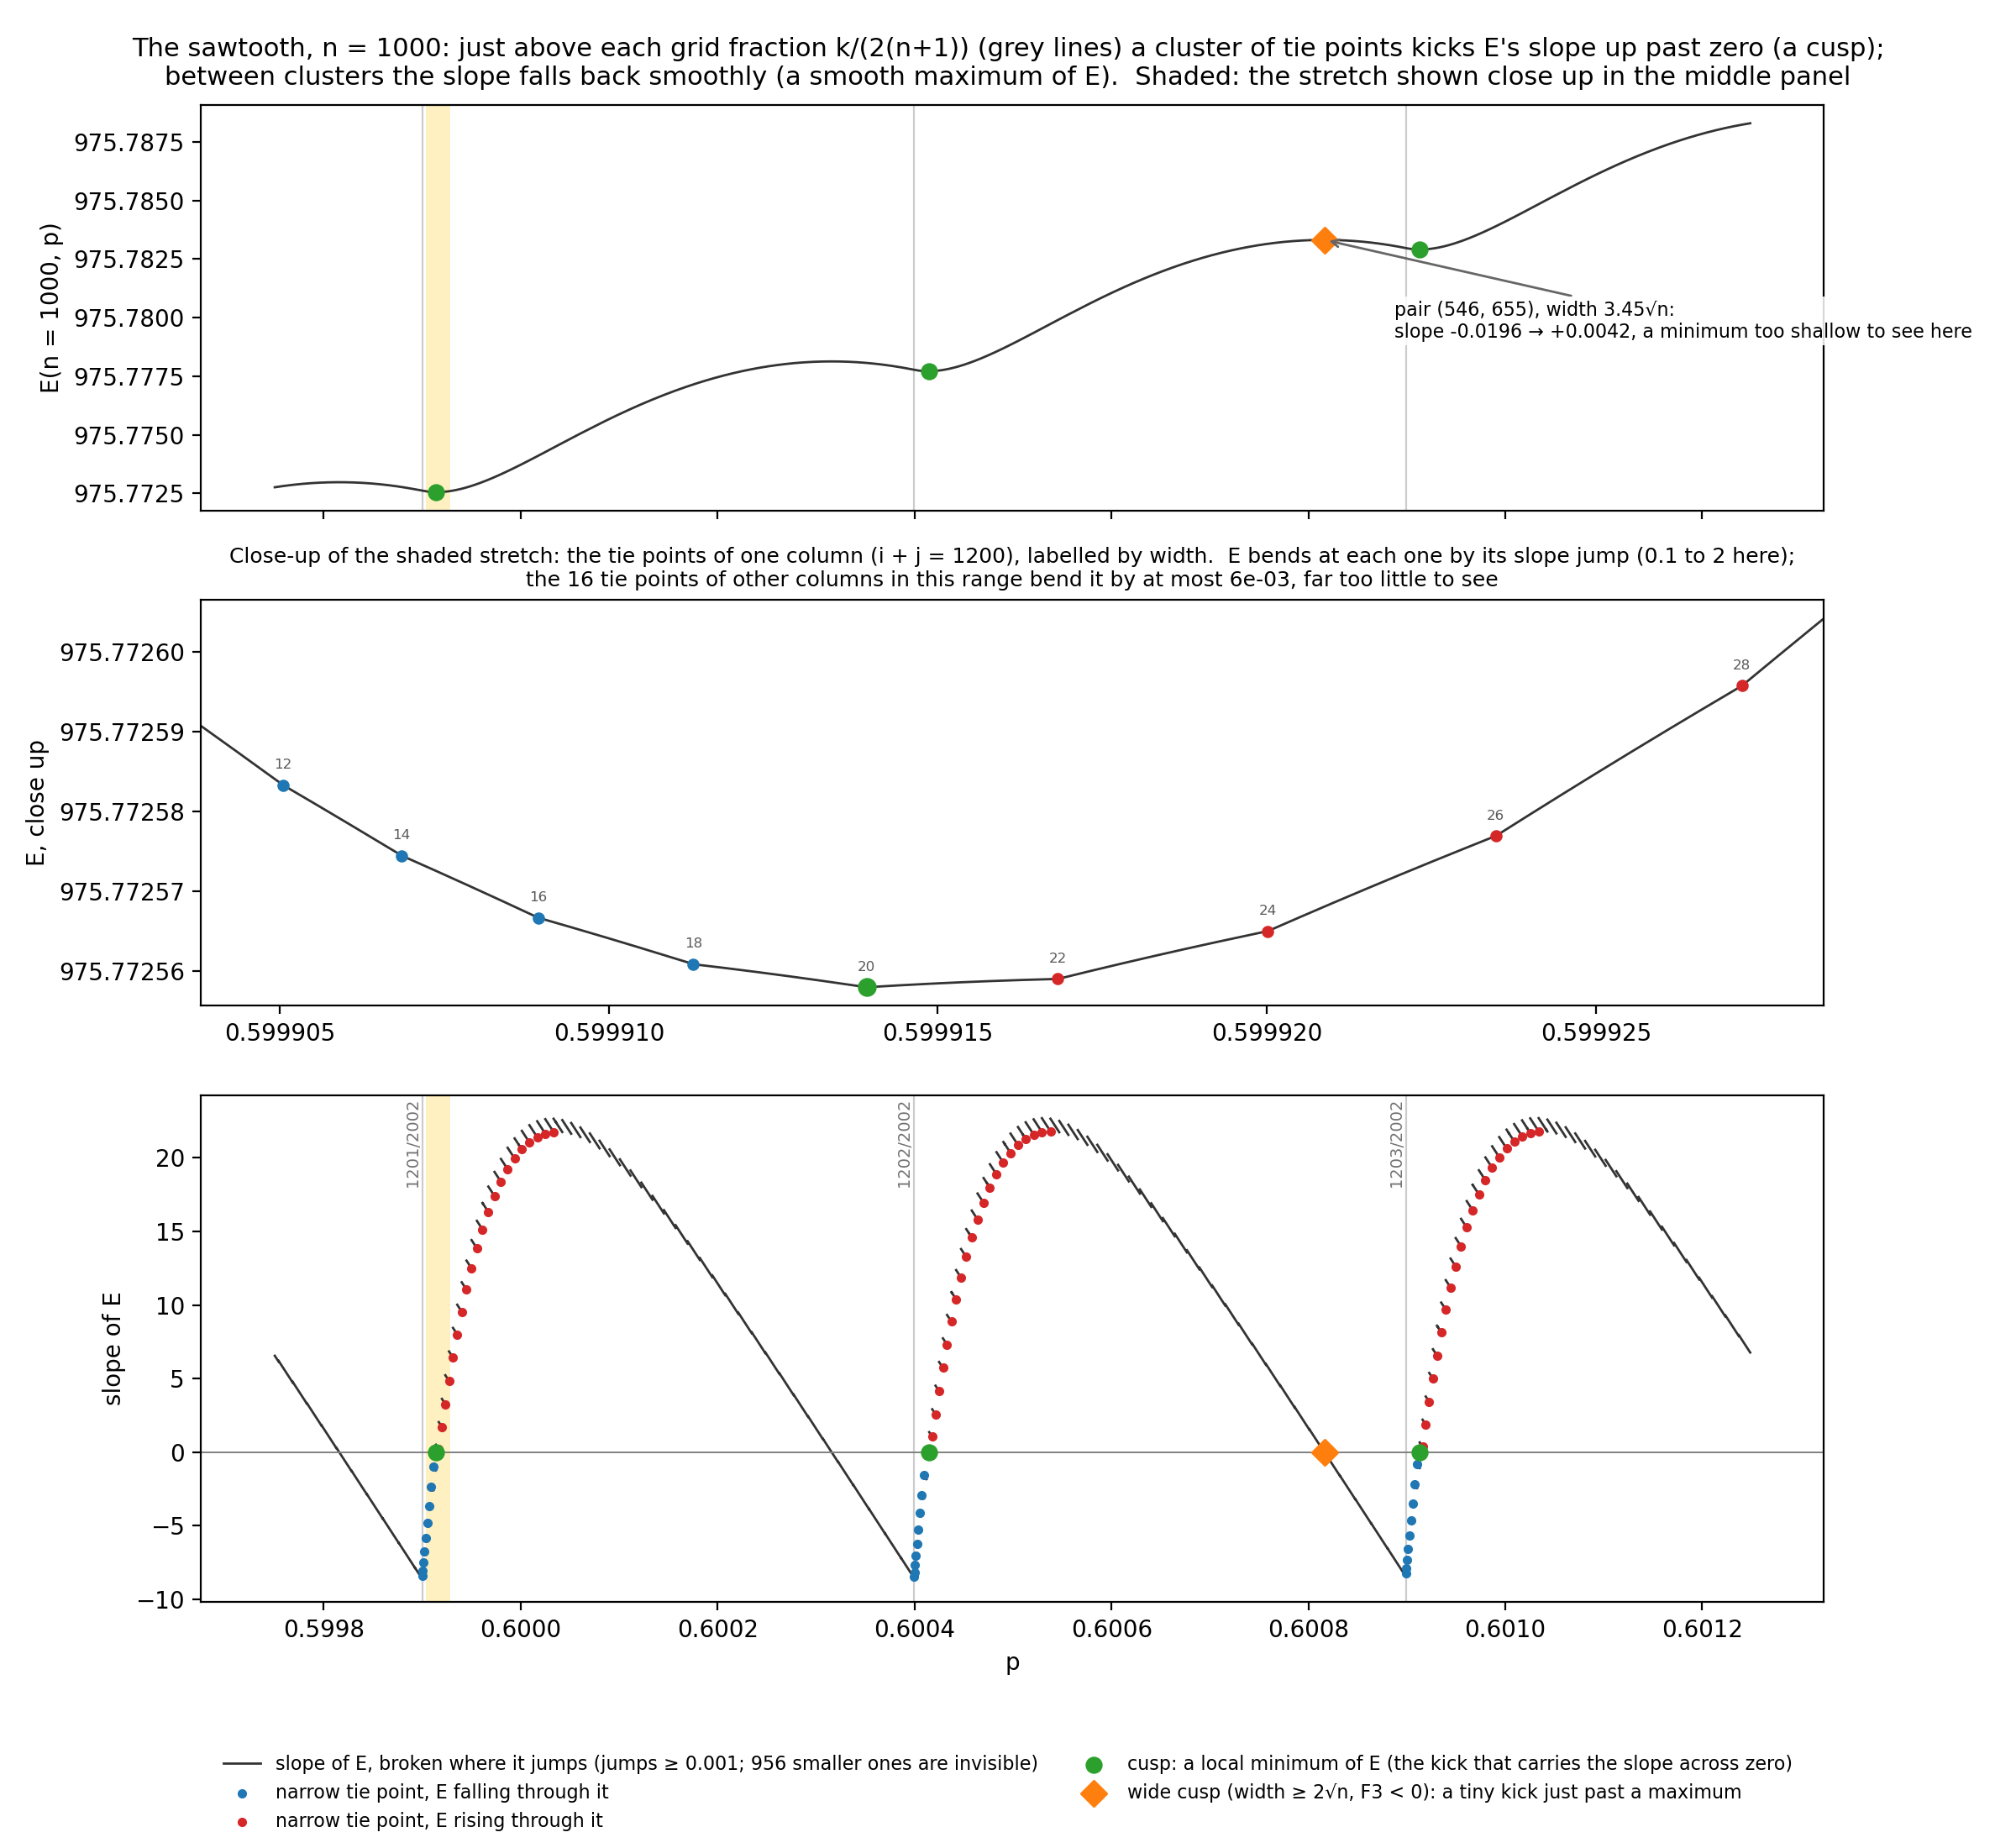
- The sawtooth: E, a close-up of one cluster of tie points, and E's slope with its jumps, across three grid fractions at n = 1000: how each cluster makes a cusp